IMAGE

Figure 6

ID
ZDB-IMAGE-201229-84
Source
Figures for Candiani et al., 2020
Image
Figure Caption

Figure 6

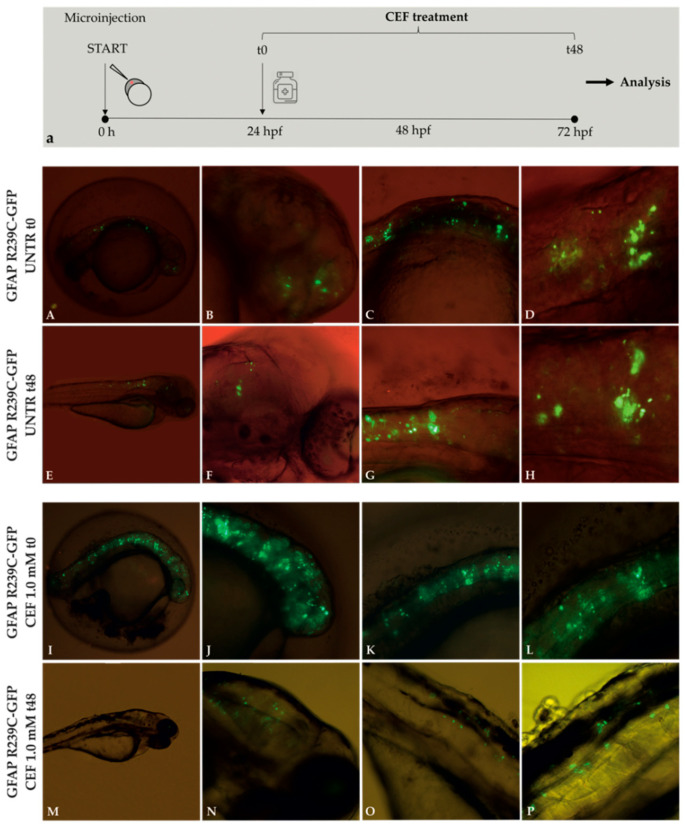
Experimental plan showing the timeline of ceftriaxone (CEF) treatments and the effects of 48 h CEF 1.0 mM treatment on embryos expressing GFAP R239C-GFP. (a). The antibiotic ceftriaxone was added 24 h after eggs microinjection. This moment was defined as “time zero” (t0). Fluorescence microscope analysis. Aggregates in untreated (UNTR) embryos are shown in figure (AD) at 24 hpf (t0) and from (EH) at 72 hpf (t48), corresponding to the start and end points of CEF treatment. Figure (IL) show aggregates at 24 hpf (t0), while figure (MP) show aggregates at 72 hpf (t48), after 48 h of treatment with CEF 1.0 mM. Magnification: 4× (A,E,I,M); 10× (B,C,F,G,J, K,N,O); 20× (D,H,L,P).

Acknowledgments
This image is the copyrighted work of the attributed author or publisher, and ZFIN has permission only to display this image to its users. Additional permissions should be obtained from the applicable author or publisher of the image. Full text @ Genes (Basel)