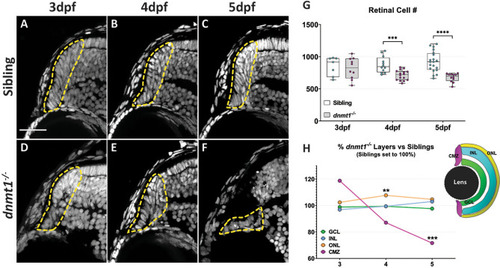
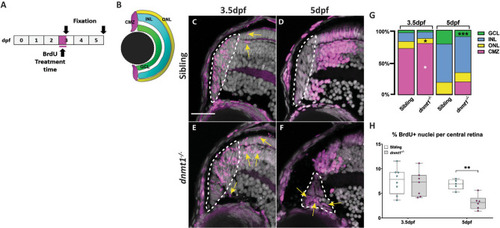
Disruption of dnmt1 function results in CMZ defects. AF DAPI staining of nuclei (gray) within the CMZ (white dotted lines delineate CMZ boundaries) of siblings (AC) and dnmt1−/− (DF) larvae from 3 to 5dpf. G Average number of all nuclei within the central retina of siblings and mutants. Each data point is the average of cell counts from three different 12 μm sections in one eye of a single larva. H Proportional changes of dnmt1−/− retinal domains (GCL, INL, ONL, and CMZ) relative to siblings (set to 100%). Colors correspond with retinal domains in diagram. Scale bars = 30 μm. **p < 0.005, ***p < 0.0005; ****p < 0.00005. Dorsal is up in all images.

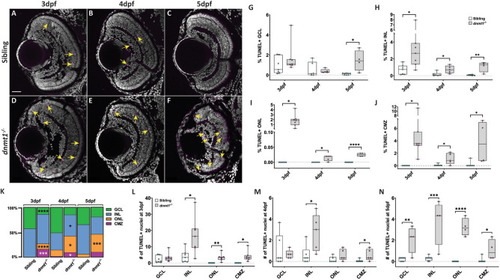
Cell death is elevated in the dnmt1−/− CMZ. AF dnmt1 sibling (AC) and mutant (DF) retinae labeled with DAPI (gray; nuclei) and TUNEL (magenta; dsDNA breaks) from 3 to 5dpf. GJ Proportion of retinal layers (GCL, INL, ONL, and CMZ) labeled by TUNEL staining. K Proportion of TUNEL+ cells within each layer from 3 to 5dpf. LN Average number of TUNEL+ cells in each retinal layer of siblings and dnmt1−/− larvae from 3 to 5dpf. Yellow arrows in AF indicate TUNEL+ nuclei. Scale bars = 30 µm. *p < 0.05, **p < 0.005, ***p < 0.0005, ****p < 0.00005. Dorsal is up in all images.

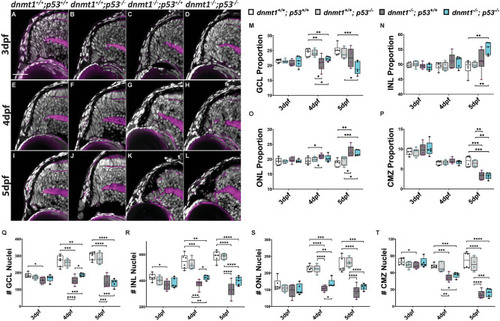
Loss of p53 function does not rescue the dnmt1−/− CMZ phenotype. AL Transverse sections of the dorsal CMZ in wildtype (A, E, I), dnmt1+/+; p53−/− (B, F, J), dnmt1−/−; p53+/+ (C, G, K), dnmt1−/−; p53−/− (D, H, L) larvae from 3 to 5dpf. Nuclei labeled with DAPI (gray) and F-actin labeled with phalloidin (magenta). MP Graphs depicting changes in retinal domain proportions over time. QT Number of nuclei in each retinal domain of dnmt1+/+; p53+/+, dnmt1+/+; p53-/, dnmt1−/−; p53+/+, and dnmt1−/−; p53−/− larvae from 3 to 5dpf. GCL ganglion cell layer, INL inner nuclear layer, ONL outer nuclear layer; CMZ ciliary marginal zone. Scale bars = 25 μm. *p < 0.05; **p < 0.005; ***p < 0.0005; ****p < 0.00005. Dorsal is up in all images.

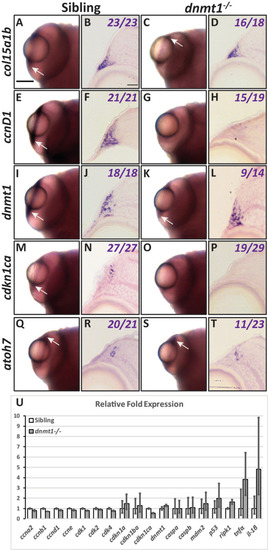
dnmt1 is required to maintain RSC gene expression. Gene expression shown in whole mount (A, C, E, G, I, K, M, O, Q, S) and transverse cryosections (B, D, F, H, J, L, N, P, R, T) between siblings and dnmt1−/− larvae. ADcol15a1b expression. EHccnD1 expression. ILdnmt1 expression. MPcdkn1ca expression. QTatoh7 expression. Numbers in transverse cryosections designate the number of larvae that showed the displayed expression pattern versus the total number of larvae analyzed. Scale bars = 75 mm (whole mount) and 10 μm (transverse sections). Anterior is up in all whole-mounts and dorsal is up for all section images. U qPCR results showing relative gene expression levels of cell cycle genes (ccna2, ccnb1, ccnd1, ccne, cdk1, cdk2, and cdk4), cell arrest genes (caspa, caspb, mdm2, p53, and ripk1), and inflammatory response genes (tnfα and il-1β) in whole 4dpf sibling (white bars) and dnmt1−/− (gray bars) larvae.

RSCs require dnmt1 function to maintain proliferation. AF Transverse sections of siblings (AC) and dnmt1−/− (DF) larvae from 3 to 5dpf. Nuclei labeled with DAPI (gray). Cells in S-phase indicated by BrdU incorporation (magenta). Mitotic cells are labeled by a pH3(ser10) antibody (cyan). G Proportions of CMZ cells in S-phase (magenta), G2/M-phase (cyan), or not proliferating (gray) of both siblings and dnmt1−/−larvae from 3 to 5dpf. H Proportion of CMZ cells labeled with BrdU from 3 to 5dpf between controls and dnmt1−/−larvae. I Proportion of CMZ cells labeled with pH3 from 3 to 5dpf between controls and dnmt1−/−larvae. White dotted lines designate CMZ (AF). Scale bars: 30 μm *p < 0.05, **p < 0.005, ***p < 0.0005, ****p < 0.00005. Dorsal is up in all images.

Neurons produced by dnmt1−/− RSCs fail to integrate into the neural retina. A Experimental paradigm depicting BrdU incorporation from 3 to 3.5dpf. Fixations occurred at 3.5 and 5dpf. B Diagram of the four retinal domains (CMZ, GCL, INL, and ONL) whose colors correlate with the data presented in G. CF Transverse sections of BrdU pulses from 3 to 3.5dpf (C,E) and pulse-chase assay from 3 to 5dpf (D, F) (Siblings: A, B; dnmt1−/−C, D). Nuclei labeled with DAPI (gray). Cells in S-phase indicated by BrdU incorporation (magenta). Mitotic cells are labeled by a pH3(ser10) antibody (cyan). G Proportion of BrdU + cells located in each retinal layer at 3.5dpf and 5dpf of dnmt1−/− and control larvae. H Proportion of total BrdU+ cells within the central retina of the pulse-chase experiment. White dotted lines designate the CMZ (CF). Yellow arrows = BrdU+ nuclei outside the CMZ (C, E). Scale bars: 20 μm. *p < 0.05, **p < 0.005, ***p < 0.0005. Dorsal is up in all images.

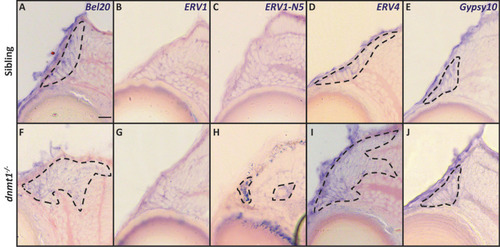
Loss of dnmt1 function results in misregulation of retroelement expression. AJ Transverse cryosections of sibling (AE) and dnmt1−/− (FJ) larvae at 4dpf. A, F Expression of Bel20 LTR. B, G Expression of ERV1 LTR. C, H Expression of ERV1-N5 LTR. D, I Expression of ERV4 LTR. E, J Expression of Gypsy10 LTR. Dotted lines: domains of retroelement expression. Scale bars = 10 μm. Dorsal is up in all images.

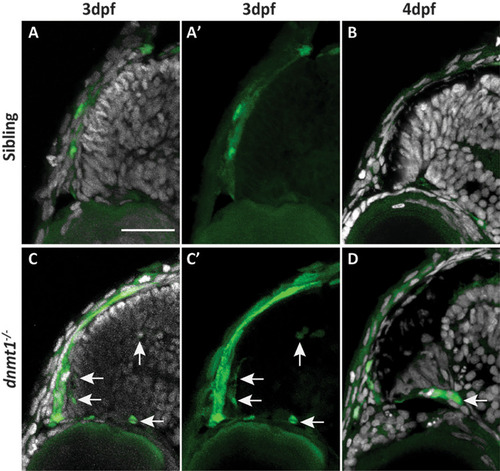
RSCs require dnmt1 function to repress L1RE3-EGFP transposition. AD Transverse sections of Tg(CMV:Hsa.L1RE3, EGFP, myl7:EGFP; dnmt1+/+) (A, B) and Tg(CMV:Hsa.L1RE3, EGFP, myl7:EGFP; dnmt1−/−) (C, D) larvae at 3dpf (A, A′, C, C′) and 4dpf (B, D). Nuclei labeled with DAPI (gray). Endogenous EGFP expression activated after L1RE3-EGFP transposition labeled in green. Arrows delineate EGFP + cells. Scale bars: 30 μm. Dorsal is up in all images.

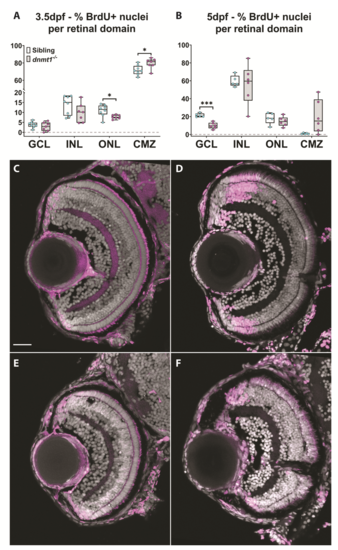
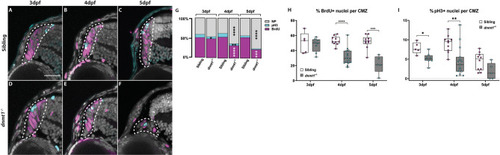
dnmt1-deficient RSCs fail to incorporate into the neural retina. A. Data points collected of the proportion of cells labeled with BrdU in each retinal domain at 3.5dpf divided by the number of total BrdU+ cells. B. Data points collected of the proportion of cells labeled with BrdU in each layer at 5dpf divided by the number of total BrdU+ cells. Sibling controls = white bars; dnmt1-/- = gray bars. *p <0.05, ***p <0.0005. C-F. Transverse sections of sibling (C-D) and dnmt1-/- (E-F) retinae at 3.5dpf (C,E) and 5dpf (D,F). Nuclei labeled with DAPI (gray). BrdU+ cells (magenta). Dorsal is up in all images. Scale bar (C) = 30 μm. All images taken at the same magnification.

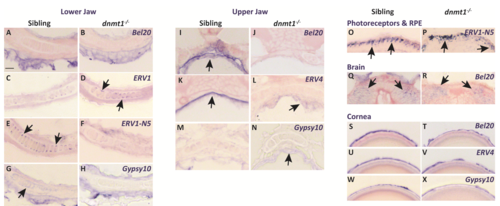
Loss of dnmt1 function results in misregulation of LTR RE expression across numerous tissues. A-X. Transverse cryosections of larvae analyzed by in situ hybridization. All sibling and dnmt1-/- larvae are 4dpf. A-H. Expression of indicated REs within the lower jaw. I-N. Expression of indicated REs within the upper jaw. O-P. Expression of ERV1-N5 LTR in photoreceptors (O; sibling) and the RPE (P; dnmt1-/-). Q-R. Expression of Bel20 LTR within the brain. S-X. Expression of indicated REs within the cornea. Arrows delineate expression changes of specified REs. Scale bar (A) = 10 μm. All images taken at the same magnification. RPE = retinal pigmented epithelium. 

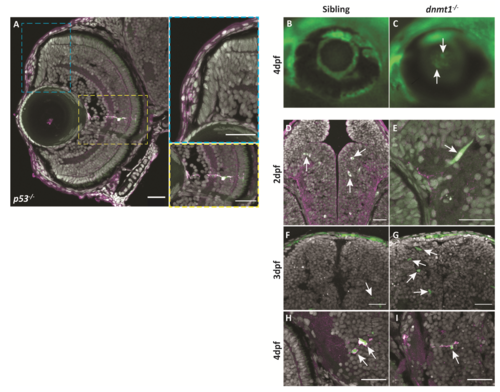
L1RE3-EGFP transgene expression is more prominent in dnmt1-/- larvae. A-A’’. Transverse section of Tg(CMV:Hsa.L1RE3,EGFP,myl7:EGFP;p53-/-) larvae at 4dpf. A. L1RE3-EGFP+ retinal cells labeled with endogenous EGFP. Cyan (A‘) and yellow (A’‘) dotted boxes indicate magnified images to the right of panel A. A’. Magnified image of Tg(CMV:Hsa.L1RE3,EGFP,myl7:EGFP;p53-/-) CMZ showing no expression of the L1RE3-EGFP transgene. A’’. Magnified image of retinal neuron expressing L1RE3-EGFP transgene. B-I. All images are taken from Tg(CMV:Hsa.L1RE3,EGFP,myl7:EGFP) larvae that are either dnmt1+/+ (B,D,F,H) or dnmt1-/- (C,E,G,I). B-C. Whole-mount images of 4dpf eyes demonstrating L1RE3-EGFP transgene activation seen through the lens of dnmt1-/- larvae and not siblings. D,F,H. Sibling larvae expressing the L1RE3-EGFP transgene in the brain. E,G,I. dnmt1-/- larvae expressing the L1RE3-EGFP transgene in the brain. Nuclei labeled with DAPI (gray). Endogenous L1RE3-activated EGFP labeled in green. EGFP antibody is magenta. Scale bars: 30 μm in all images. Dorsal is up in all images.

Acknowledgments
This image is the copyrighted work of the attributed author or publisher, and ZFIN has permission only to display this image to its users. Additional permissions should be obtained from the applicable author or publisher of the image. Full text @ Sci. Rep.