IMAGE

Figure 2

ID
ZDB-IMAGE-200713-13
Source
Figures for Angileri et al., 2020
Image
Figure Caption

Figure 2

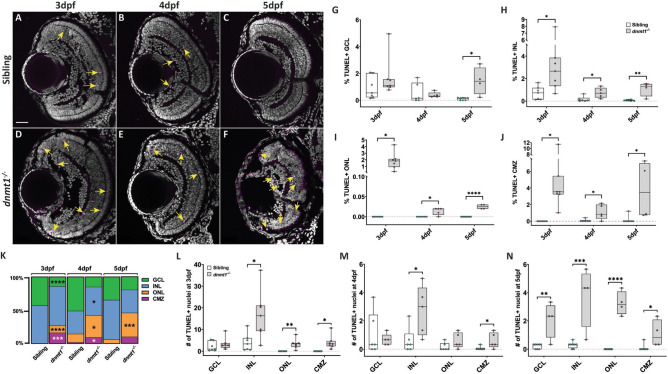
Cell death is elevated in the dnmt1−/− CMZ. AF dnmt1 sibling (AC) and mutant (DF) retinae labeled with DAPI (gray; nuclei) and TUNEL (magenta; dsDNA breaks) from 3 to 5dpf. GJ Proportion of retinal layers (GCL, INL, ONL, and CMZ) labeled by TUNEL staining. K Proportion of TUNEL+ cells within each layer from 3 to 5dpf. LN Average number of TUNEL+ cells in each retinal layer of siblings and dnmt1−/− larvae from 3 to 5dpf. Yellow arrows in AF indicate TUNEL+ nuclei. Scale bars = 30 µm. *p < 0.05, **p < 0.005, ***p < 0.0005, ****p < 0.00005. Dorsal is up in all images.

Acknowledgments
This image is the copyrighted work of the attributed author or publisher, and ZFIN has permission only to display this image to its users. Additional permissions should be obtained from the applicable author or publisher of the image. Full text @ Sci. Rep.