
- Title
-
Fovea-like Photoreceptor Specializations Underlie Single UV Cone Driven Prey-Capture Behavior in Zebrafish
- Authors
- Yoshimatsu, T., Schröder, C., Nevala, N.E., Berens, P., Baden, T.
- Source
- Full text @ Neuron

UV Light Greatly Facilitates Visually Guided Prey Capture in Larval Zebrafish (A) Schematic representation of visual prey capture by larval zebrafish. (B) Setup for filming paramecia. A filter wheel equipped with UV and yellow bandpass filters was positioned in front of the charge-coupled device (CCD) camera to image paramecia in a naturalistic tank in the sun. (C) Peak-normalized spectra for the UV and yellow channels (thick lines; (D) Example frames from the yellow and UV channels taken consecutively from the same position. (E) Zoom in from (D), with line profiles extracted as indicated. Arrowheads highlight paramecia visible in the UV channel. See also (F) Schematic of behavioral setup. Individual larval zebrafish (7–8 dpf) in the presence of free-swimming paramecia were head-mounted and filmed from above, with infrared illumination from below. (G) Top illumination was provided by intensity-matched UV (374 ± 15 nm) or yellow (507 ± 10 nm) LEDs, which mainly activated UV/blue and red/green opsins, respectively, as indicated. (H) Top: zebrafish consistently responded more readily to passing paramecia with full prey-capture bouts (eye convergence + tail flicks, each event indicated with a marker) during UV-illumination periods. See also |
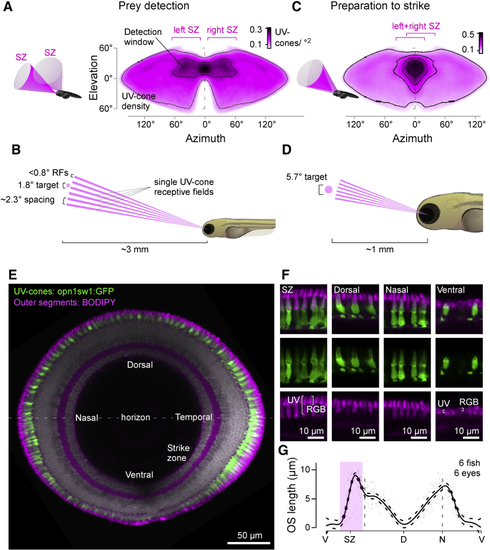
The Detector Hardware for UV Vision in Larval Zebrafish (A–D) UV cone density projected into sinusoidal map of visual space when eyes are in resting position for initial prey detection (A) and once converged for prey localization following detection (C). A 100-μm paramecium is too small for reliable detection at ∼3 mm distance and can therefore only be seen by a single UV cone at a time (B). Even at ∼1 mm strike distance, it covers at most a handful of UV cones per eye (D). 3D schematics (A and C) illustrate approximate visual space surveyed by the two SZs. Scale bars, UV cones/°. See also (E) Sagittal section across the eye with outer segments (OSs) stained by BODIPY (magenta) and UV cones expressing GFP (green, (F) Higher magnification sections from (E). Note that BODIPY stains the OSs of all photoreceptors, as well as the spot-like pocket of mitochondria immediately below the OS ( (G) Mean and 95% confidence intervals of UV cone OS lengths across the eye. V, ventral; SZ, strike zone; D, dorsal; N, nasal. Open-source 3D fish model created by M.Y. Zimmermann. |
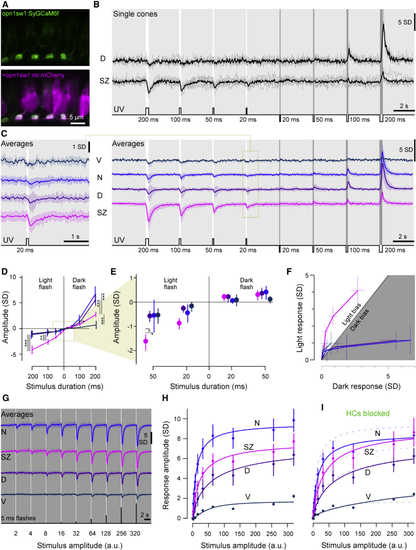
Imaging Cone Calcium in the Live Eye (A) Confocal images of synaptically targeted GCaMP6f (green, (B) Mean and single trial dorsal and SZ single cone 2-photon calcium responses to varying duration light- (6 × 10⁵ photon/s/μm2) and dark-steps (0 photon/s/μm2) from a constant UV background (2.4 × 10⁴ photon/s/μm2). (C) Mean calcium responses to the same stimulus as in (B) from ventral, nasal, dorsal, and SZ cones (V, N, D, and SZ; n = 9, 21, 23, and 29, respectively). Shadings represent ±1 SD. Left panel shows an enlargement of the response to the 20-ms light step. (D) Mean and 95% confidence intervals of peak amplitudes from (C). (E) Enlargement from (D). All responses except nasal and ventral 20-ms dark-flash conditions were significantly different from zero (Mann-Whitney (F) Light and dark responses from (C) and (D) plotted against each other for equivalent stimulus durations, with 95% confidence intervals indicated. (G and H) Mean calcium responses to increasing-amplitude 5-ms light flashes from darkness, as indicated (G), and quantification (mean and 95% confidence intervals) with Hill functions fitted (H). (I) Quantification of calcium responses as in (G) and (H) following horizontal cell (HC) blockage using CNQX. For better comparison, curves from (H) are added as faint dashed lines. n = 51, 29, 46, and 17 for SZ, D, N, and V, respectively, for control and n = 51, 32, 46, and 19 after HC block. |
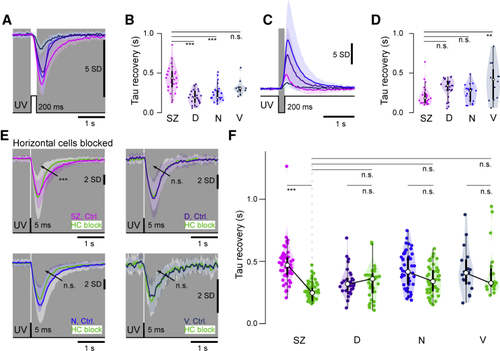
Temporal Tuning of UV Cones (A) Mean ± 1 SD responses to a 200-ms flash of light (6 × 10⁵ photon/s/μm2) from darkness (0 photon/s/μm2). (B) Box and violin plots of recovery time constants from (G). n = 29, 29, 23, and 13 for SZ, D, N, and V, respectively. (C and D) As in (A) and (B), but for an equivalent contrast dark flash. n = 27, 24, 19, and 13 for SZ, D, N, and V, respectively. ANOVA test ∗p < 0.02, ∗∗∗p < 0.0001 (H and J). n.s., not significant. (E) Mean ± 1 SD (shadings) calcium responses to a 5-ms light flash from darkness before (shades of purple) and after HC blockage using CNQX (green). (F) Quantification of recovery time constant after a 5-ms UV flash at 104 photons/cone. n = 51, 29, 46, and 17 for SZ, D, N and V, respectively for the control condition and n = 51, 32, 46, and 19 after HC block. ANOVA test ∗∗p < 0.01, ∗∗∗p < 0.001. n.s., not significant. |
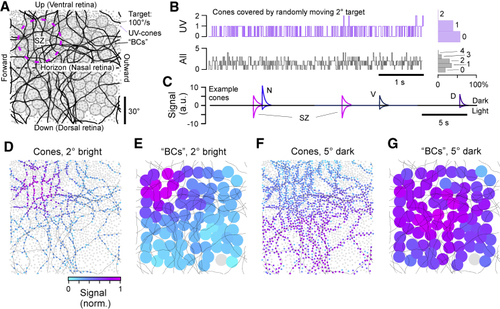
A Model of UV Cone Activation by a Small Moving Target (A) Model setup. Monocular UV cone distribution across the visual field (gray dots) with model bipolar cell (BC) array superimposed (filled circles) and target paths black line. The SZ was centered in the upper left quadrant, corresponding to the upper frontal visual field. (B) Number of cones touched by a moving 2° plotted as a trace over time, with histogram to the right. Top: UV cones. Bottom: any-type cone. (C) Time trace of model cone activation of four example cones, taken from representative regions across the array. Responses below and above zero correspond to activation in response to a 2° bright and 5° dark target, respectively. (D) Maximal activation levels of each cone over the full path for a 2° bright target, normalized to peak activation across the entire array. (E) Activation of BCs driven by UV cones in (D). (F and G) As in (D) and (E) but for a 5° dark target. |
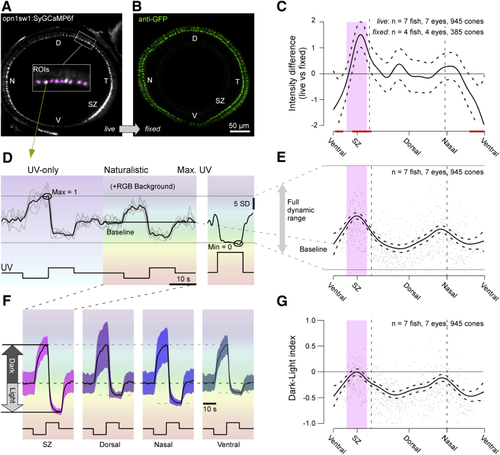
Calcium Baseline Predicts Dark-Light Responses (A and B) Whole-eye sagittal view of UV cone SyGCaMP6f in live (C) Mean and 95% confidence intervals of the difference between live SyGCaMP6f signal per cone as in (A) and fixed signal as in (B), with red lines indicating regions that were significantly different from zero. (D) Example mean and individual trial single cone response to 0 photon/s/μm2 dark and 6 × 10⁵ photon/s/μm2 light steps from a constant brightness UV 3 × 10⁵ photon/s/μm2 without and with spectrally broad background light. After five repeats, a 1.5 × 10⁷ photon/s/μm2 UV light step was presented to drive calcium to a minimum (right). (E) Mean and 95% confidence interval of calcium baseline relative to the full dynamic range as indicated, with single datapoints in the back. (F) Mean ± 1 SD calcium responses to light and dark contrasts with naturalistic RGB background light across all UV cones in specified regions. Traces were shifted and scaled to align the baseline and peak dark response. (G) Mean and 95% confidence intervals of dark-light index (DLi) with single datapoints in the back. |

Tuning of Phototransduction Cascade Elevates SZ Baseline (A) UV cone RNA sequencing (RNA-seq) workflow. Retinas from 7 dpf zebrafish (B and C) All detected genes in UV cones ranked by expression label, with phototransduction genes highlighted (B), and zoom in to the top 200 genes (C). The two most highly expressed genes are both non-protein-coding genes; therefore, UV opsin is the highest expressed protein-coding gene. (D) Mean gene expression ratio between SZ and non-SZ batches, with phototransduction genes highlighted. (E) As in (D), but normalized to UV-opsin expression level in each batch and zoomed in to high expression phototransduction targets. Green and gray markers denote activators and repressors of the photo-response, respectively. Error bars represent SEM. (F) Schematic of phototransduction based on (G) Simulated current response of SZ and non-SZ UV cones to 100% dark and light contrasts from a 50% contrast background based on (H) Effects of expression changes of individual phototransduction components compared to non-SZ. (I) Mean calcium responses to a flash of light from darkness in SZ, nasal, and dorsal UV cones from (J) Output of full phototransduction model to an equivalent stimulus between SZ and non-SZ batches. (K) Full model output to a series of increasing amplitude 5-ms light flashes from darkness for SZ and non-SZ batches. (L and M) Stimulus-response data from SZ and average of non-SZ data (N+D+V) from |

Synaptic Release Accentuates Functional Differences between UV Cones (A and B) Schematic of HC dendrites at photoreceptor synaptic invaginations. SFiGluSnFR expression in HC dendrites is well positioned to detect glutamate release from ribbon synapses (bar structure) at single terminals of any cone type. UV cones are identified by co-expression of mCherry as before. OS, outer segment; ONL, outer nuclear layer; OPL, outer plexiform layer; INL, inner nuclear layer. (C) (D) Scan field for SFiGluSnFR recordings. Individual HC dendritic bundles at single cone terminals are readily visible. ROIs 3 and 7 are associated with UV cones as seen by overlap with the mCherry signal. A map of pixel-to-pixel correlation over time ( (E) Partial example trace of mean and individual trial glutamate responses of ROIs from (D) to a tetrachromatic binary noise stimulus ( (F) Correlation of glutamate responses across pairs of ROIs. ROIs 3 and 7 are highly correlated only to each other. Color code is based on each ROI’s preferred response as in (G). (G) Linear filters (“kernels”) recovered by reverse correlation of each ROI’s response to the noise tetrachromatic stimulus (E). R, G, B, and U denote red, green, blue, and UV light, respectively. UV cones are highlighted by asterisks. (H) Partial example trace of mean calcium (SyGCaMP6f) and glutamate (SFiGluSnFR) responses of SZ and dorsal UV cones to the tetrachromatic noise stimulus. Background shading indicates UV light and dark stimulus periods. Arrowheads highlight enhanced glutamate response transients from SZ relative to dorsal UV cones. (I) Signal-to-noise ratio in the Fourier domain and resulting information rate in calcium responses across UV cones from different regions. (J) As in (I), computed for glutamate responses. n = 35, 20, 28, and 18 for calcium in SZ, D, N, and V, respectively, and 51, 20, 22, and 18 for glutamate SZ, D, N, and V, respectively. |