
|
Figure 8
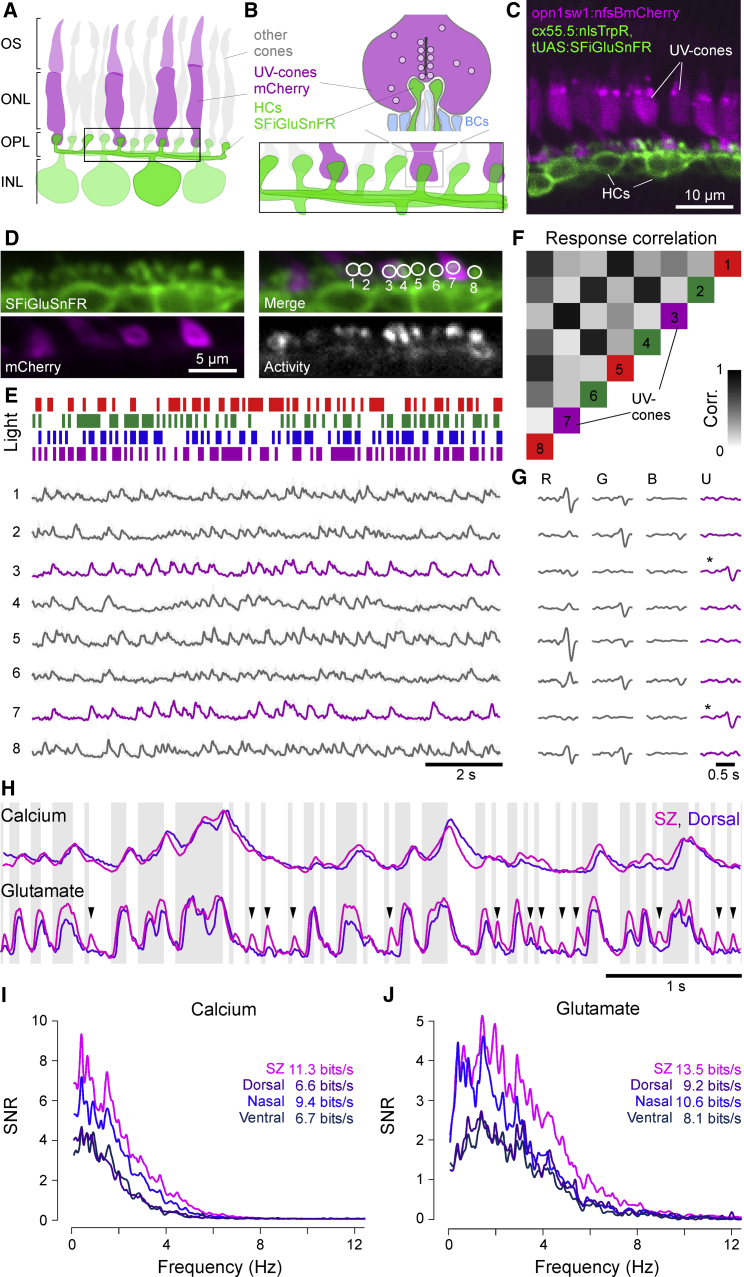
Synaptic Release Accentuates Functional Differences between UV Cones
(A and B) Schematic of HC dendrites at photoreceptor synaptic invaginations. SFiGluSnFR expression in HC dendrites is well positioned to detect glutamate release from ribbon synapses (bar structure) at single terminals of any cone type. UV cones are identified by co-expression of mCherry as before. OS, outer segment; ONL, outer nuclear layer; OPL, outer plexiform layer; INL, inner nuclear layer.
(C)
(D) Scan field for SFiGluSnFR recordings. Individual HC dendritic bundles at single cone terminals are readily visible. ROIs 3 and 7 are associated with UV cones as seen by overlap with the mCherry signal. A map of pixel-to-pixel correlation over time (
(E) Partial example trace of mean and individual trial glutamate responses of ROIs from (D) to a tetrachromatic binary noise stimulus (
(F) Correlation of glutamate responses across pairs of ROIs. ROIs 3 and 7 are highly correlated only to each other. Color code is based on each ROI’s preferred response as in (G).
(G) Linear filters (“kernels”) recovered by reverse correlation of each ROI’s response to the noise tetrachromatic stimulus (E). R, G, B, and U denote red, green, blue, and UV light, respectively. UV cones are highlighted by asterisks.
(H) Partial example trace of mean calcium (SyGCaMP6f) and glutamate (SFiGluSnFR) responses of SZ and dorsal UV cones to the tetrachromatic noise stimulus. Background shading indicates UV light and dark stimulus periods. Arrowheads highlight enhanced glutamate response transients from SZ relative to dorsal UV cones.
(I) Signal-to-noise ratio in the Fourier domain and resulting information rate in calcium responses across UV cones from different regions.
(J) As in (I), computed for glutamate responses. n = 35, 20, 28, and 18 for calcium in SZ, D, N, and V, respectively, and 51, 20, 22, and 18 for glutamate SZ, D, N, and V, respectively.