
Figure 6
- ID
- ZDB-FIG-200801-34
- Publication
- Yoshimatsu et al., 2020 - Fovea-like Photoreceptor Specializations Underlie Single UV Cone Driven Prey-Capture Behavior in Zebrafish
- Other Figures
- All Figure Page
- Back to All Figure Page
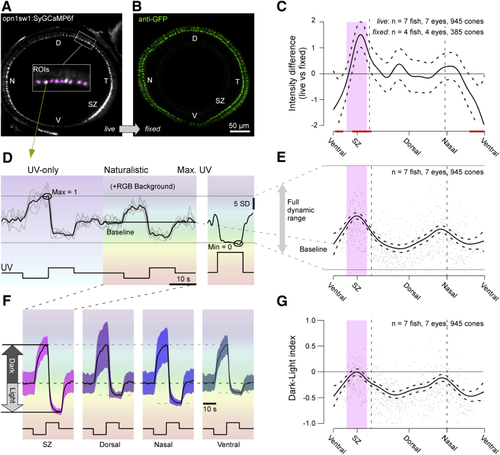
Calcium Baseline Predicts Dark-Light Responses (A and B) Whole-eye sagittal view of UV cone SyGCaMP6f in live (C) Mean and 95% confidence intervals of the difference between live SyGCaMP6f signal per cone as in (A) and fixed signal as in (B), with red lines indicating regions that were significantly different from zero. (D) Example mean and individual trial single cone response to 0 photon/s/μm2 dark and 6 × 10⁵ photon/s/μm2 light steps from a constant brightness UV 3 × 10⁵ photon/s/μm2 without and with spectrally broad background light. After five repeats, a 1.5 × 10⁷ photon/s/μm2 UV light step was presented to drive calcium to a minimum (right). (E) Mean and 95% confidence interval of calcium baseline relative to the full dynamic range as indicated, with single datapoints in the back. (F) Mean ± 1 SD calcium responses to light and dark contrasts with naturalistic RGB background light across all UV cones in specified regions. Traces were shifted and scaled to align the baseline and peak dark response. (G) Mean and 95% confidence intervals of dark-light index (DLi) with single datapoints in the back. |