
|
Figure 2
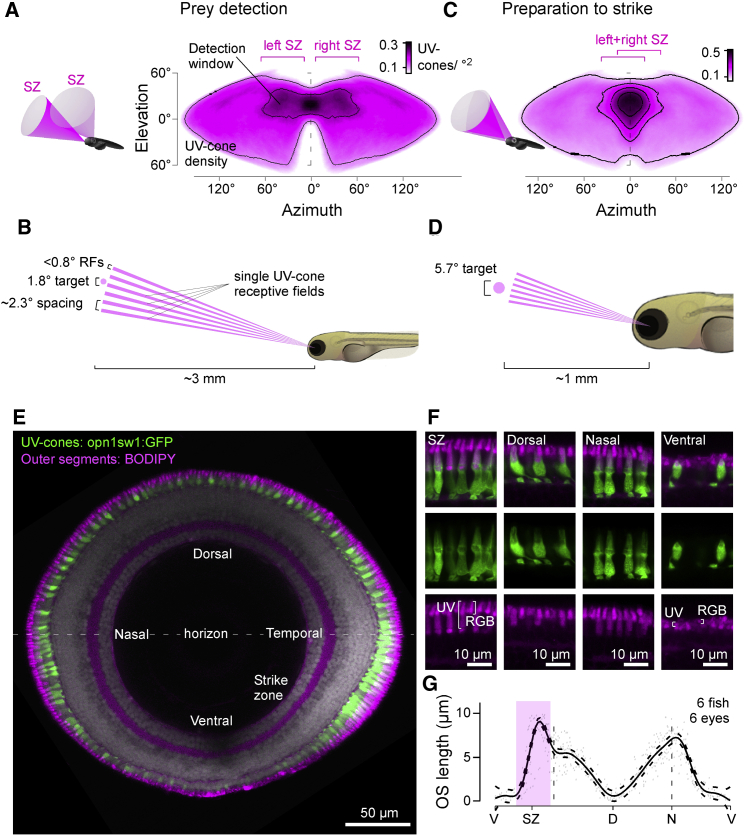
The Detector Hardware for UV Vision in Larval Zebrafish
(A–D) UV cone density projected into sinusoidal map of visual space when eyes are in resting position for initial prey detection (A) and once converged for prey localization following detection (C). A 100-μm paramecium is too small for reliable detection at ∼3 mm distance and can therefore only be seen by a single UV cone at a time (B). Even at ∼1 mm strike distance, it covers at most a handful of UV cones per eye (D). 3D schematics (A and C) illustrate approximate visual space surveyed by the two SZs. Scale bars, UV cones/°. See also
(E) Sagittal section across the eye with outer segments (OSs) stained by BODIPY (magenta) and UV cones expressing GFP (green,
(F) Higher magnification sections from (E). Note that BODIPY stains the OSs of all photoreceptors, as well as the spot-like pocket of mitochondria immediately below the OS (
(G) Mean and 95% confidence intervals of UV cone OS lengths across the eye. V, ventral; SZ, strike zone; D, dorsal; N, nasal. Open-source 3D fish model created by M.Y. Zimmermann.