
Figure 5
- ID
- ZDB-FIG-200801-33
- Publication
- Yoshimatsu et al., 2020 - Fovea-like Photoreceptor Specializations Underlie Single UV Cone Driven Prey-Capture Behavior in Zebrafish
- Other Figures
- All Figure Page
- Back to All Figure Page
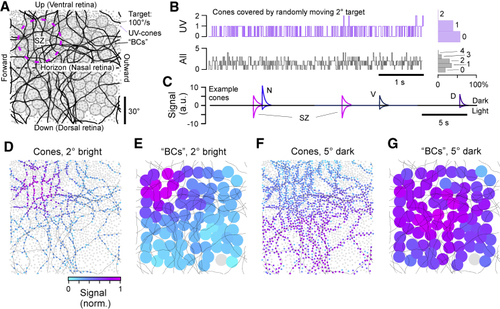
A Model of UV Cone Activation by a Small Moving Target (A) Model setup. Monocular UV cone distribution across the visual field (gray dots) with model bipolar cell (BC) array superimposed (filled circles) and target paths black line. The SZ was centered in the upper left quadrant, corresponding to the upper frontal visual field. (B) Number of cones touched by a moving 2° plotted as a trace over time, with histogram to the right. Top: UV cones. Bottom: any-type cone. (C) Time trace of model cone activation of four example cones, taken from representative regions across the array. Responses below and above zero correspond to activation in response to a 2° bright and 5° dark target, respectively. (D) Maximal activation levels of each cone over the full path for a 2° bright target, normalized to peak activation across the entire array. (E) Activation of BCs driven by UV cones in (D). (F and G) As in (D) and (E) but for a 5° dark target. |