
- Title
-
A Rare KIF1A Missense Mutation Enhances Synaptic Function and Increases Seizure Activity
- Authors
- Guo, Y., Chen, Y., Yang, M., Xu, X., Lin, Z., Ma, J., Chen, H., Hu, Y., Ma, Y., Wang, X., Tian, X.
- Source
- Full text @ Front Genet

Rare variants in |

Schematic representation of KIF1A protein and locations of mutations in human KIF1A associated with various neuronal disorders. These mutations are distributed in various locations and domains of the KIF1A subunit protein peptide ( |

Effect of mutant |
Effect of mutant |

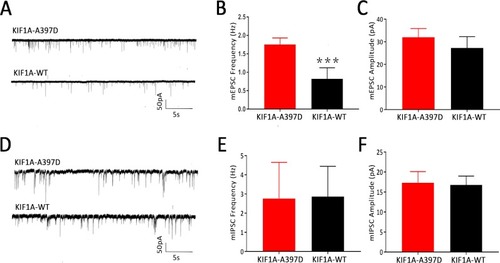
Effect of mutant |

Effect of mutant |

Overexpression of mutant Kif1aa causes abnormal behavior and epileptiform discharges in transgenic zebrafish larvae. |