IMAGE

Figure 5

ID
ZDB-IMAGE-200406-61
Source
Figures for Guo et al., 2020
Image
Figure Caption

Figure 5

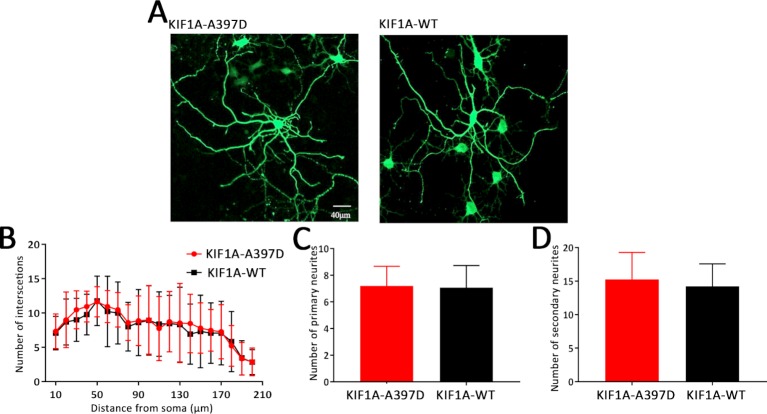
Effect of mutant KIF1A on neuronal development. (A) Representative image of cultured primary hippocampal neurons obtained through a Sholl analysis. The radius interval between circles was 10 μm per step and ranged from 10 to 210 μm from the center of the neuronal soma. (B) Sholl analysis of neurons expressing the mutant (n = 15 neurons) or wild-type protein (n = 13 neurons) (two-way ANOVA). (C, D) Number of primary and secondary neurites of neurons expressing the mutant (n = 15 neurons) or wild-type protein (n = 13 neurons) (Student's t test).

Acknowledgments
This image is the copyrighted work of the attributed author or publisher, and ZFIN has permission only to display this image to its users. Additional permissions should be obtained from the applicable author or publisher of the image. Full text @ Front Genet