
- Title
-
The telomere bouquet is a hub where meiotic double-strand breaks, synapsis, and stable homolog juxtaposition are coordinated in the zebrafish, Danio rerio
- Authors
- Blokhina, Y.P., Nguyen, A.D., Draper, B.W., Burgess, S.M.
- Source
- Full text @ PLoS Genet.

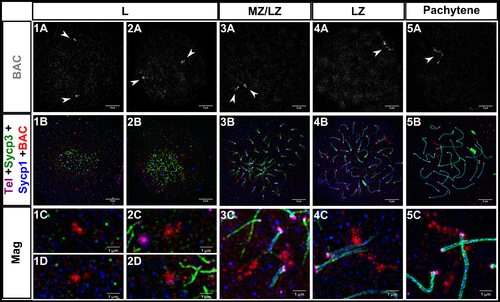
Homologous chromosome synapsis in male zebrafish meiosis I. 1A-6A: Loading of the chromosome axis protein, Sycp3 (green), initiates near the telomeres (Tel; magenta) in the bouquet and extends inward from both ends of the chromosome during meiotic prophase progression at the indicated stages (leptotene (L); leptotene to zygotene transition (L/EZ); early to mid-zygotene (EZ/MZ); mid to late zygotene (MZ/LZ); late zygotene (LZ); pachytene). 1B-6B: Sycp3 loading is closely followed by the initiation of SC formation, marked by Sycp1 (gray in row B to highlight features of the SC, blue in following rows)). 1C-6C: Merge of Sycp3, Sypc1 and Tel staining. 1D-6D: Merge of all signals plus DNA staining with DAPI. 1E-6G: Magnifications of three different regions (Mag 1, Mag 2, and Mag3) for each of the corresponding panels above; each magnified region is specified in images 1C-6C by long arrows. 1E, 1G-6G: Telomere associations are seen at all stages (arrowheads). 2G: Telomere association between three telomeres. 1F-2F: Short stretches of pre-synaptic co-alignment (triple arrows). 3F-4F: Chromosomes with more than one synapsis initiation site (orange arrows). 1A-6D scale bar = 5 μm. 1E-6G scale bar = 1 μm.
EXPRESSION / LABELING:
|
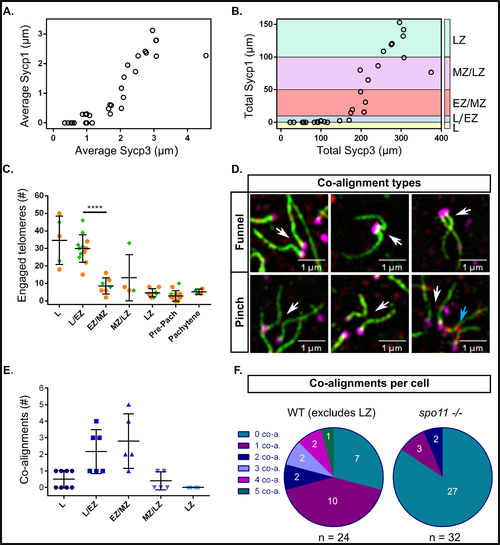
Measurements of Sycp3 vs. Sycp1 length, numbers of engaged telomeres, and numbers of co-alignments in male zebrafish meiosis I. A: Average Sycp3 length vs. average Sycp1 length. Each circle represents the average of all measurements in one nucleus (n = 30 nuclei). B: Total Sycp3 length vs. total Sycp1 length in the same cells shown in A. Stages of meiosis are defined by total length of Sycp1: leptotene (L, Sycp1 = 0 μm; yellow); leptotene to zygotene transition (L/EZ, Sycp1 = 1–10 μm; blue); early to mid-zygotene (EZ/MZ, Sycp1 = 10–50 μm; pink); mid to late zygotene (MZ/LZ, Sycp1 = 50–100 μm; purple); late zygotene (LZ, Sycp1 > 100 μm; cyan). C: Numbers of engaged telomeres per cell, where one engaged telomere end is an Sycp3 line with its telomere associated with a potentially non-homologous telomere end. Each point represents one cell. The data was pooled from two experiments done on different days (set 1, orange circles; set 2, green diamonds). The highest numbers of engaged telomere ends were observed in L and L/EZ stages after which point there was a significant decrease in engaged telomere ends in the EZ/MZ category, p < 0.0001 (unpaired t test with Welch’s correction), however, some number of engaged ends were maintained throughout prophase I. D: Examples of funnel and pinch co-alignment configurations. In the funnel configuration the co-alignment is directly adjacent to the telomeres; in the pinch configuration the co-alignment is not directly adjacent to the telomeres. White arrows point to the co-aligned regions. The blue arrow points to a pinch configuration where SC has already started to form (not counted as co-aligned). E: Total numbers of co-alignments in different stage cells of meiosis I prophase. Each point represents one cell. F: Numbers of co-alignments (0–5) in individual cells in WT (n = 24) and spo11 -/- (n = 32) males. The LZ class was excluded from the WT representation as at this stage synapsis has typically initiated at the majority of telomere ends. spo11 -/- cells, where synapsis is mostly abolished, were assessed for co-alignment if they appeared to have Sycp3 lines of similar lengths to the leptotene and zygotene classes of WT.
|
Measurements of Sycp3 vs. Homologous chromosome pairing at interstitial sites is coincident with synapsis in zebrafish male meiosis I. 1A-5A: Fluorescent in situ hybridization with a BAC probe (gray, white arrowheads) to a region ~10Mb from the telomere on chromosome 5. 1B-5B: Same images as 1A-5A plus telomeres (Tel; magenta), Sycp3 (green), and Sycp1 (blue); the BAC is in red. 1C-5C, 1D-2D: Magnifications (Mag) for each of the corresponding panels above. 1A-5B scale bar = 5 μm. Mag scale bar = 1 μm. Leptotene (L), mid to late zygotene (MZ/LZ); late zygotene (LZ). Note that images for panel series 3 and 5 are from a spreading procedure performed on a separate day from panel series 1, 2, and 4, and are included to illustrate a rare observation where BAC probes are located on axes where SC is extending (3C) and also where the BAC signal is highly elongated (5C).
EXPRESSION / LABELING:
|

Homologous chromosome synapsis and pairing in female zebrafish meiosis I. 1A-5B: Sycp3 (green) loading and synapsis (Sycp1; blue), begin near telomeres (Tel; magenta) and progress inwards, similarly to what is seen in zebrafish males. 6A-8A: BAC (red), Sycp3 (green), Sycp1 (blue), Telomeres (Tel; magenta). 6B-8B: Same images as 6A-8A with only the BAC shown (gray; arrowheads). Scale bar = 5 μm.
EXPRESSION / LABELING:
|
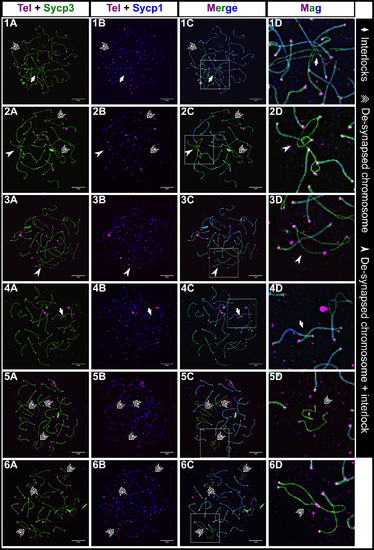
Interlocks and de-synapsed chromosomes in male zebrafish meiosis I. 1A-6C: Examples of nuclear surface spreads showing interlocks (arrows) and de-synapsed chromosomes (triple arrows) at the late zygotene to pachytene stage where most chromosomes are synapsed. In some cases, de-synapsed chromosomes have another chromosome passing through them (arrowheads). 1D-6D: Magnification (Mag) images are from regions indicated by white boxes in the merge panels. Sycp3 (green), Sycp1 (blue), Telomeres (Tel; magenta). Scale bar = 5μm.
EXPRESSION / LABELING:
|
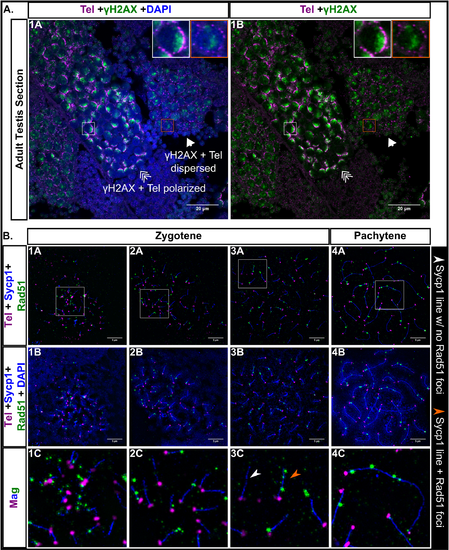
Double strand break (DSB) localization during male zebrafish meiosis I. A: Testis section stained for γH2AX (green), telomeres (Tel; magenta), and DNA (DAPI, blue). γH2AX staining is polarized when the telomeres are in bouquet formation (triple arrow, white boxes) and is more scattered when the telomeres are dispersed (arrow, orange boxes). Scale bar = 20 μm. B: Panels 1A-4C: Nuclear surface spreads stained for Sycp1 (blue), Rad51 (green), telomeres (Tel, magenta) and DNA (DAPI, blue); 1C-4C: Magnified (Mag) images are from regions indicated by white boxes in the top row panels. White arrowhead points to an example of an Sycp1 stretch with no Rad51 foci. Orange arrowhead points to an example of an Sycp1 stretch with Rad51 foci. 1A-4B scale bar = 5μm.
EXPRESSION / LABELING:
|
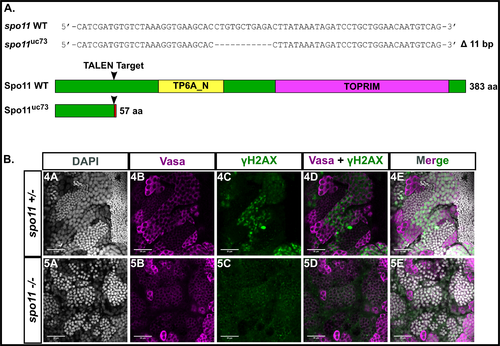
A: TALEN generated 11 bp frameshift mutation allele (spo11uc73) leads to a truncated 57 aa Spo11 protein with the conserved TP6A_N and TOPRIM family domains deleted. B: Whole testes stained for vasa (magenta), γH2AX (green), and DAPI (gray). spo11 +/-testes show a normal pattern of γH2AX staining whereas the pattern is disrupted in the spo11 -/- mutant.
|
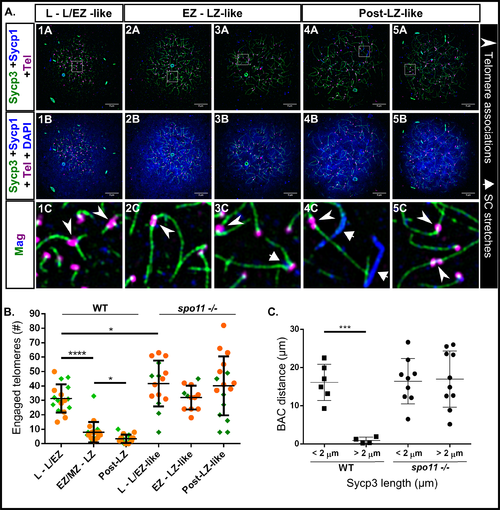
spo11 -/- males fail to properly synapse homologous chromosomes, and exhibit high numbers of engaged telomeres during meiosis I. A: 1A-5B: spo11 -/- nuclear surface spreads stained for Sycp3 (green), Sycp1 (blue), telomeres (Tel; magenta), and DNA (DAPI, blue). 1C-5C: Magnified (Mag) images are from regions indicated by white boxes in the panels above. Telomere associations are seen at all stages (arrowheads); Short stretches of Sycp1 are seen in some mutant cells (short arrows). Scale bar = 5μm. B: Numbers of engaged telomeres in WT vs. spo11 -/-cells. The mutant cells were categorized based on similarity to WT Sycp3 loading extent. Post-LZ refers to all cells that were classified as pre-pachytene or pachytene in WT and equivalent cells in spo11 mutants. The data was pooled from two experiments done on different days (set 1, orange circles; set 2, green diamonds). P values were acquired using unpaired t test with Welch’s correction. For * p ≤ 0.0314, and for **** p < 0.0001. While WT telomere engagements are reduced at later stages, the telomere engagements in spo11-/- are maintained. C: Dot plot of BAC distance measurements in WT and spo11 -/- males (in μm). In the WT during the early stages when the average Sycp3 lines are short (< 2 μm), the BAC signals are unpaired; As meiosis progresses and the Sycp3 lines elongate (> 2 μm), the BAC signals exhibit pairing (p = 0.0004, unpaired t test with Welch’s correction). In the spo11 -/- males the BAC signals remain unpaired even with extended Sycp3 axes.
|

|
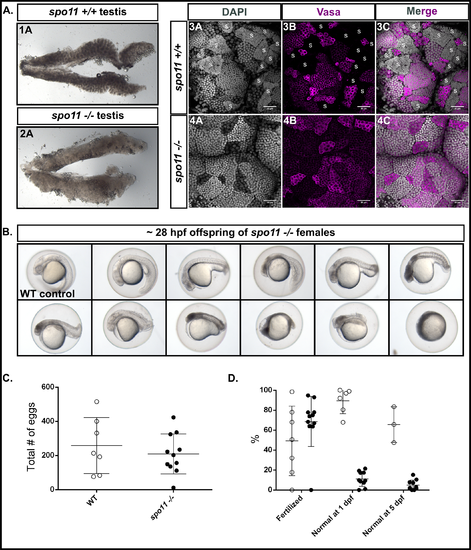
spo11 -/- males do not produce sperm, while spo11 -/- females produce offspring that show a spectrum of abnormalities. A: 1A-2A: Light microscope images of whole testes with spo11 -/- males showing a more translucent testis appearance as compared to WT. 3A-4C: Whole mount testes from WT and spo11 -/- males stained for Vasa (magenta) and DNA (DAPI, gray). Sperm clusters, indicated with "S" in WT, are absent in spo11 -/- mutants. B: Examples of offspring from spo11 -/- females showing the range of abnormalities at 28 hpf. hpf = hours post fertilization. C-D: Test crosses of spo11 -/- females (black circles) and WT control females (white circles) with WT males. Each circle represents a single test cross outcome. The data was pooled from two separate test crosses done on different days. The WT data at 5 dpf was assessed from one of the test crosses but was not tracked up to 5 days for the other WT test cross. C: spo11 -/- females produced similar numbers of eggs to WT females. D: The percent of eggs that were fertilized, and the percent of offspring that were normal or near normal in their development at 1 dpf, and at 5dpf. dpf = days post fertilization.
|