
- Title
-
Load Adaptation of Lamellipodial Actin Networks
- Authors
- Mueller, J., Szep, G., Nemethova, M., de Vries, I., Lieber, A.D., Winkler, C., Kruse, K., Small, J.V., Schmeiser, C., Keren, K., Hauschild, R., Sixt, M.
- Source
- Full text @ Cell

Correlative Analysis of Actin, Projected Cell Area, and Protrusions in Migrating Zebrafish Keratocytes (A) Confocal imaging of lifeact:GFP-expressing keratocyte moving on a glass coverslip. (B) Time frame from (A) showing the 1.09-μm wide area of lifeact:GFP intensity measurements (left), a binary mask used for quantifying the area (middle), and a pseudo-colored Horn-Schunck optical flow analysis image of the leading edge (right). (C) Fluorescence intensity and leading edge velocity maps for the time lapse of the cell shown in (A). (D) Temporal fluctuations of cell area, lifeact:GFP intensity, and protrusion speed averaged across the analyzed region shown in red in (B). (E) Average of temporal cross-correlation functions of 21 migrating keratocytes. Mean and SEM are shown. See also Figures S1 and S2 and Movie S1. |

Cytoskeletal Response to Manipulations of Membrane Tension (A) Lifeact:GFP imaging following micropipette aspiration. (1) Migrating keratocyte before contact with the micromanipulator, (2) aspiration of membrane, and (3) release of vacuum. (B) Temporal fluctuations of lifeact:GFP intensity at the leading edge defined as in Figure 1B, area, and protrusion speed. The area between the dotted lines shows where the cell was aspirated. (C) Kymograph along dashed yellow line in (A). (D) Change in lifeact:GFP signal following aspiration with four different vacuum levels. (E) Change in cell edge protrusion for the same cells as in (D). Mean and SEM are shown for 28 aspiration events in 13 individual cells in (D) and (E). (F) Lifeact:GFP signal following fast cell shrinkage. (1) Keratocyte exhibiting stretched morphology, while its trailing edge is tethered to the substrate. (2) The trailing edge is cut with a pulsed laser (yellow arrowhead). (G) Temporal fluctuations of leading edge lifeact:GFP intensity, area, and protrusion speed. The rapid retraction is marked with a dotted line. (H) Kymograph along dashed yellow line in (F). See also Figure S3 and Movie S2. |
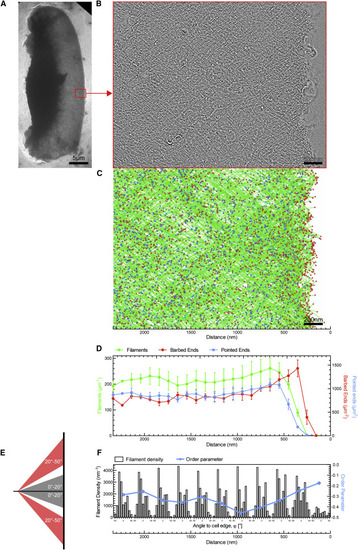
Electron Tomography of Migrating Wild-Type Keratocytes (A) Overview electron micrograph of migrating keratocyte with acquired tomogram montage marked in red. (B) 5.5-nm slice of a negatively stained tomogram of the actin network behind the leading edge. (C) Automated tracking results of the same region with filaments shown in green, barbed ends in red, and pointed ends in blue. (D) Normalized densities of filaments, barbed ends, and pointed ends in 106-nm-wide bins of four averaged tomogram montages. Graph shows mean and SEM. (E) Scheme showing the filament angle bins used for calculating the global order parameter. (F) Histogram of combined filament length growing at indicated angle toward the cell membrane (black) is shown together with a global order parameter (blue) in 212-nm distance bins defined as ((Filaments 0°–20°)−(Filaments 30°–50°))/((Filaments 0°–20°)+(Filaments 30°–50°)). See also Figures S4A and S4B. |

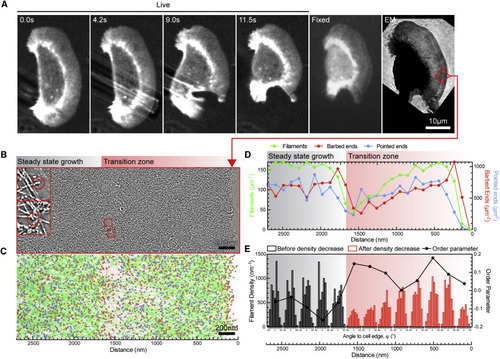
Correlated Live Microscopy-Electron Tomography of Ultrastructural Changes in Networks with Increasing Filament Density (A) A migrating keratocyte expressing lifeact:GFP was aspirated at the rear with a micropipette, fixed within ≈3 s, and prepared for electron microscopy. The cell shifted out of focus because of the manipulating procedure. A transient increase in actin density can be seen in the low-magnification electron micrograph on the right. (B) 5.5-nm tomogram slice of the region marked by a red box in (A). The rear of the cell is toward the left side of the picture, and the cell front is seen on the right. Regions of steady-state density, increased density, and decreased density are marked with black, blue, and red throughout the whole figure. (C) Filament tracks of the lamellipodium shown in (B), with actin filaments shown in green, barbed ends in red, and pointed ends in blue. (D) Filament numbers and densities of barbed and pointed ends in 106-nm-wide spatial bins throughout the lamellipodium shown in (B) and (C). (E) Histogram showing filament angles to the cell edge in 212-nm distance bins. See also Figures S4C and S4D and Movie S3. |
Correlated Live Microscopy-Electron Tomography of Ultrastructural Changes in Networks with Decreasing Filament Density (A) Migrating keratocyte manipulated with a microneedle to induce a rapid decrease in projected cell area with an accompanying decrease in lifeact:GFP signal, fixed within ≈3 s, and prepared for electron microscopy. A rapid decrease in the lifeact:GFP signal is preserved in the fixed lifeact:GFP sample and the low-magnification electron micrograph. (B) 5.5-nm tomogram slice showing the region marked with a red box in (A). The cell edge is seen on the right side, and the region of lower density is distinguishable toward the middle of the micrograph. Region of steady-state network density and decreased density are marked in black and red throughout the whole figure. (C) Filament tracks of the lamellipodium shown in (B), with actin filaments shown in green, barbed ends in red, and pointed ends in blue. (D) Filament numbers and densities of barbed and pointed ends in 106-nm-wide spatial bins throughout the lamellipodium shown in (B) and (C). (E) Histogram showing filament densities growing at the indicated angle from the membrane in 212-nm distance bins. An order parameter (blue) in 212 nm is defined like in Figure 3. See also Figures S5 and S6 and Movie S4. |
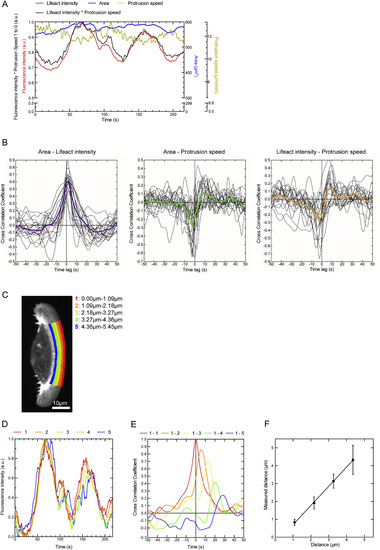
Details of Quantification of Live Cell Imaging Parameters, Related to Figure 1 (A) Temporal fluctuations of lifeact:GFP signal, projected cell area and protrusion speed of the cell shown in Figure 1 are shown normalized from the maximum value to zero. The lifeact:GFP signal multiplied by the instantaneous speed is shown normalized from the maximum to zero as well. (B) Temporal crosscorrelation functions of Area – lifeact:GFP intensity, Area-protrusion speed and lifeact:GFP intensity – Protrusion speed for 21 individual cells are shown in black. Averaged cross-correlation functions from a spline fit to the combined single-cell cross-correlation functions are shown in purple (Area – lifeact:GFP intensity), green (Area – Protrusion speed) and yellow (lifeact:GFP intensity – Protrusion speed). (C) Confocal images of a migrating keratocyte expressing lifeact:GFP were analyzed using consecutive 1.09μm wide regions spanning the lamellipodium. (D) Resulting lifeact:GFP intensity maps are plotted against time. (E) Temporal cross correlation functions of region ‘1’ at the very front of the cell to consecutive regions are plotted as a function of time lag. (F) Time lag between peaks of the curves shown in H multiplied by cell velocity and resulting distances are plotted against distance between analyzed regions. Measured mean and s.d. of twelve cells are shown together with a linear regression (Pearson constant = 0.9997, p = 0.0003). |
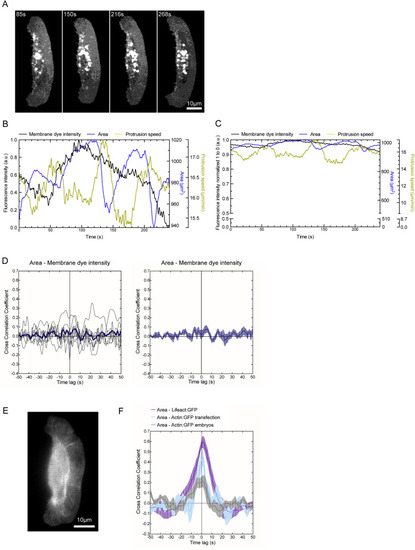
Live Cell Imaging Controls with a Membrane Marker and actin:GFP, Related to Figure 1 (A) Example images of migrating keratocytes incubated with the membrane dye CellMask. (B and C) Temporal fluctuations of the resulting intensity maps are shown normalized as in Figure 1D (B) and as in Figure S1A (C). Neither an amplification of area fluctuations nor a correlation could be observed. (D) Resulting temporal cross correlation functions for eight individual cells are shown in black and averaged cross correlation in dark blue. The averaged cross correlation as mean with s.e.m. is shown in dark blue on the right. (E) Zebrafish keratocytes transfected with actin:GFP were analyzed in the same way as shown before for lifeact:GFP. (F) Temporal cross correlation analysis area – GFP signal intensity showing peaks at time lag zero for transfected cells expressing actin:GFP and lifeact:GFP. Additionally cells generated from actin:GFP microinjected Zebrafish embryos were analyzed and showed a positive cross correlation coefficient at time lag zero. Plot shows averaged cross correlation and s.e.m. for seven cells for both actin:GFP transfection and mRNA injection. |
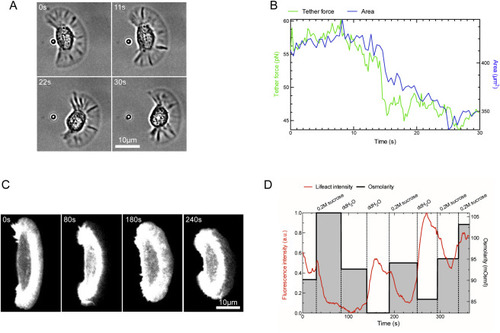
Membrane Tension Measurement by Tether Pulling and Membrane Tension Manipulation by Changing Osmotic Pressure, Related to Figure 2 (A) A migrating keratocyte was imaged with bright field microscopy and simultaneously a coated bead controlled by a laser tweezer was used to pull a membrane tether. (B) The measured tether force decrease correlated with rapid decreases in projected cell area. (C) A lifeact:GFP expressing keratocyte was imaged by confocal microscopy and subjected to rapid changes in osmotic pressure of the medium by alternating additions of 0.2M sucrose and pure water. (D) lifeact:GFP signal is negatively correlated with the osmolarity of the medium. When the pressure increases upon addition of 0.2M sucrose, lifeact:GFP signal drops, which is reversible upon restoring a lower osmotic pressure by addition of pure water. |
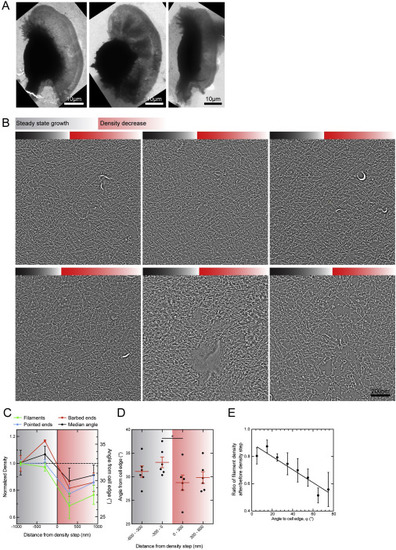
Changes in Filament Parameters at a Decrease in Filament Density, Related to Figure 5 (A and B) Network structure analysis of seven lamellipodia tomograms in three correlated cells revealed consistent features at the point, where the actin density decreased due to the manipulation by the micropipette. Overview electron micrographs and 5.5nm tomogram slices are shown for all regions. (C) Averages of filament density, barbed and pointed ends and median angle from the cell edge showed the consistent changes at the density step. (D) Median angles of all analyzed regions are plotted for 300nm space bins before and after the decrease in actin filament density (right). (Paired t test, p = 0.0249). (E) Normalized ratio of filaments after density step to filaments before density step is plotted against the filament angle from the cell edge together with a linear regression curve. (Pearson constant, r = −0.936) Mean and s.e.m. are shown on all graphs. |
Reprinted from Cell, 171, Mueller, J., Szep, G., Nemethova, M., de Vries, I., Lieber, A.D., Winkler, C., Kruse, K., Small, J.V., Schmeiser, C., Keren, K., Hauschild, R., Sixt, M., Load Adaptation of Lamellipodial Actin Networks, 188-200.e16, Copyright (2017) with permission from Elsevier. Full text @ Cell