
Fig. 3
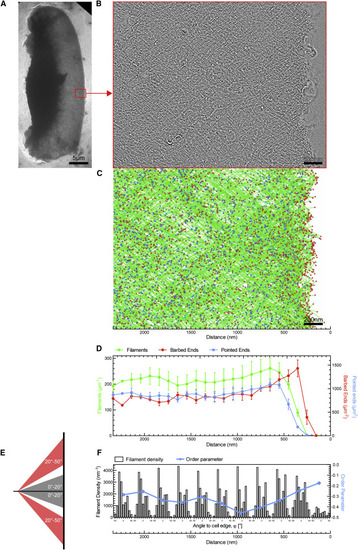
Electron Tomography of Migrating Wild-Type Keratocytes (A) Overview electron micrograph of migrating keratocyte with acquired tomogram montage marked in red. (B) 5.5-nm slice of a negatively stained tomogram of the actin network behind the leading edge. (C) Automated tracking results of the same region with filaments shown in green, barbed ends in red, and pointed ends in blue. (D) Normalized densities of filaments, barbed ends, and pointed ends in 106-nm-wide bins of four averaged tomogram montages. Graph shows mean and SEM. (E) Scheme showing the filament angle bins used for calculating the global order parameter. (F) Histogram of combined filament length growing at indicated angle toward the cell membrane (black) is shown together with a global order parameter (blue) in 212-nm distance bins defined as ((Filaments 0°–20°)−(Filaments 30°–50°))/((Filaments 0°–20°)+(Filaments 30°–50°)). See also Figures S4A and S4B. |
Reprinted from Cell, 171, Mueller, J., Szep, G., Nemethova, M., de Vries, I., Lieber, A.D., Winkler, C., Kruse, K., Small, J.V., Schmeiser, C., Keren, K., Hauschild, R., Sixt, M., Load Adaptation of Lamellipodial Actin Networks, 188-200.e16, Copyright (2017) with permission from Elsevier. Full text @ Cell