
|
Fig. 5
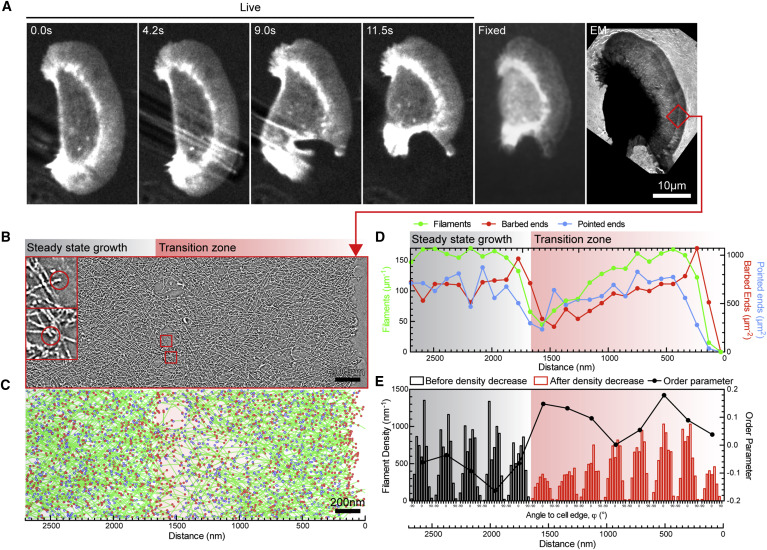
Correlated Live Microscopy-Electron Tomography of Ultrastructural Changes in Networks with Decreasing Filament Density
(A) Migrating keratocyte manipulated with a microneedle to induce a rapid decrease in projected cell area with an accompanying decrease in lifeact:GFP signal, fixed within ≈3 s, and prepared for electron microscopy. A rapid decrease in the lifeact:GFP signal is preserved in the fixed lifeact:GFP sample and the low-magnification electron micrograph.
(B) 5.5-nm tomogram slice showing the region marked with a red box in (A). The cell edge is seen on the right side, and the region of lower density is distinguishable toward the middle of the micrograph. Region of steady-state network density and decreased density are marked in black and red throughout the whole figure.
(C) Filament tracks of the lamellipodium shown in (B), with actin filaments shown in green, barbed ends in red, and pointed ends in blue.
(D) Filament numbers and densities of barbed and pointed ends in 106-nm-wide spatial bins throughout the lamellipodium shown in (B) and (C).
(E) Histogram showing filament densities growing at the indicated angle from the membrane in 212-nm distance bins. An order parameter (blue) in 212 nm is defined like in Figure 3.
See also Figures S5 and S6 and Movie S4.
Reprinted from Cell, 171, Mueller, J., Szep, G., Nemethova, M., de Vries, I., Lieber, A.D., Winkler, C., Kruse, K., Small, J.V., Schmeiser, C., Keren, K., Hauschild, R., Sixt, M., Load Adaptation of Lamellipodial Actin Networks, 188-200.e16, Copyright (2017) with permission from Elsevier. Full text @ Cell