
|
Fig. s2
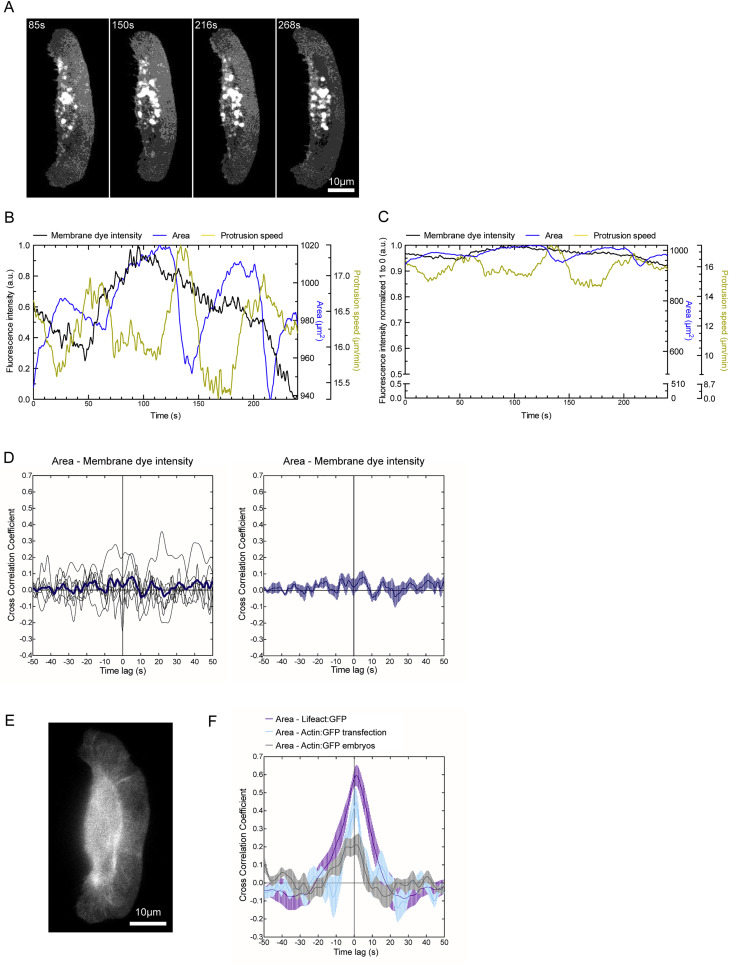
Live Cell Imaging Controls with a Membrane Marker and actin:GFP, Related to Figure 1
(A) Example images of migrating keratocytes incubated with the membrane dye CellMask.
(B and C) Temporal fluctuations of the resulting intensity maps are shown normalized as in Figure 1D (B) and as in Figure S1A (C). Neither an amplification of area fluctuations nor a correlation could be observed.
(D) Resulting temporal cross correlation functions for eight individual cells are shown in black and averaged cross correlation in dark blue. The averaged cross correlation as mean with s.e.m. is shown in dark blue on the right.
(E) Zebrafish keratocytes transfected with actin:GFP were analyzed in the same way as shown before for lifeact:GFP.
(F) Temporal cross correlation analysis area – GFP signal intensity showing peaks at time lag zero for transfected cells expressing actin:GFP and lifeact:GFP. Additionally cells generated from actin:GFP microinjected Zebrafish embryos were analyzed and showed a positive cross correlation coefficient at time lag zero. Plot shows averaged cross correlation and s.e.m. for seven cells for both actin:GFP transfection and mRNA injection.
Reprinted from Cell, 171, Mueller, J., Szep, G., Nemethova, M., de Vries, I., Lieber, A.D., Winkler, C., Kruse, K., Small, J.V., Schmeiser, C., Keren, K., Hauschild, R., Sixt, M., Load Adaptation of Lamellipodial Actin Networks, 188-200.e16, Copyright (2017) with permission from Elsevier. Full text @ Cell