
|
Fig. 1
Correlative Analysis of Actin, Projected Cell Area, and Protrusions in Migrating Zebrafish Keratocytes
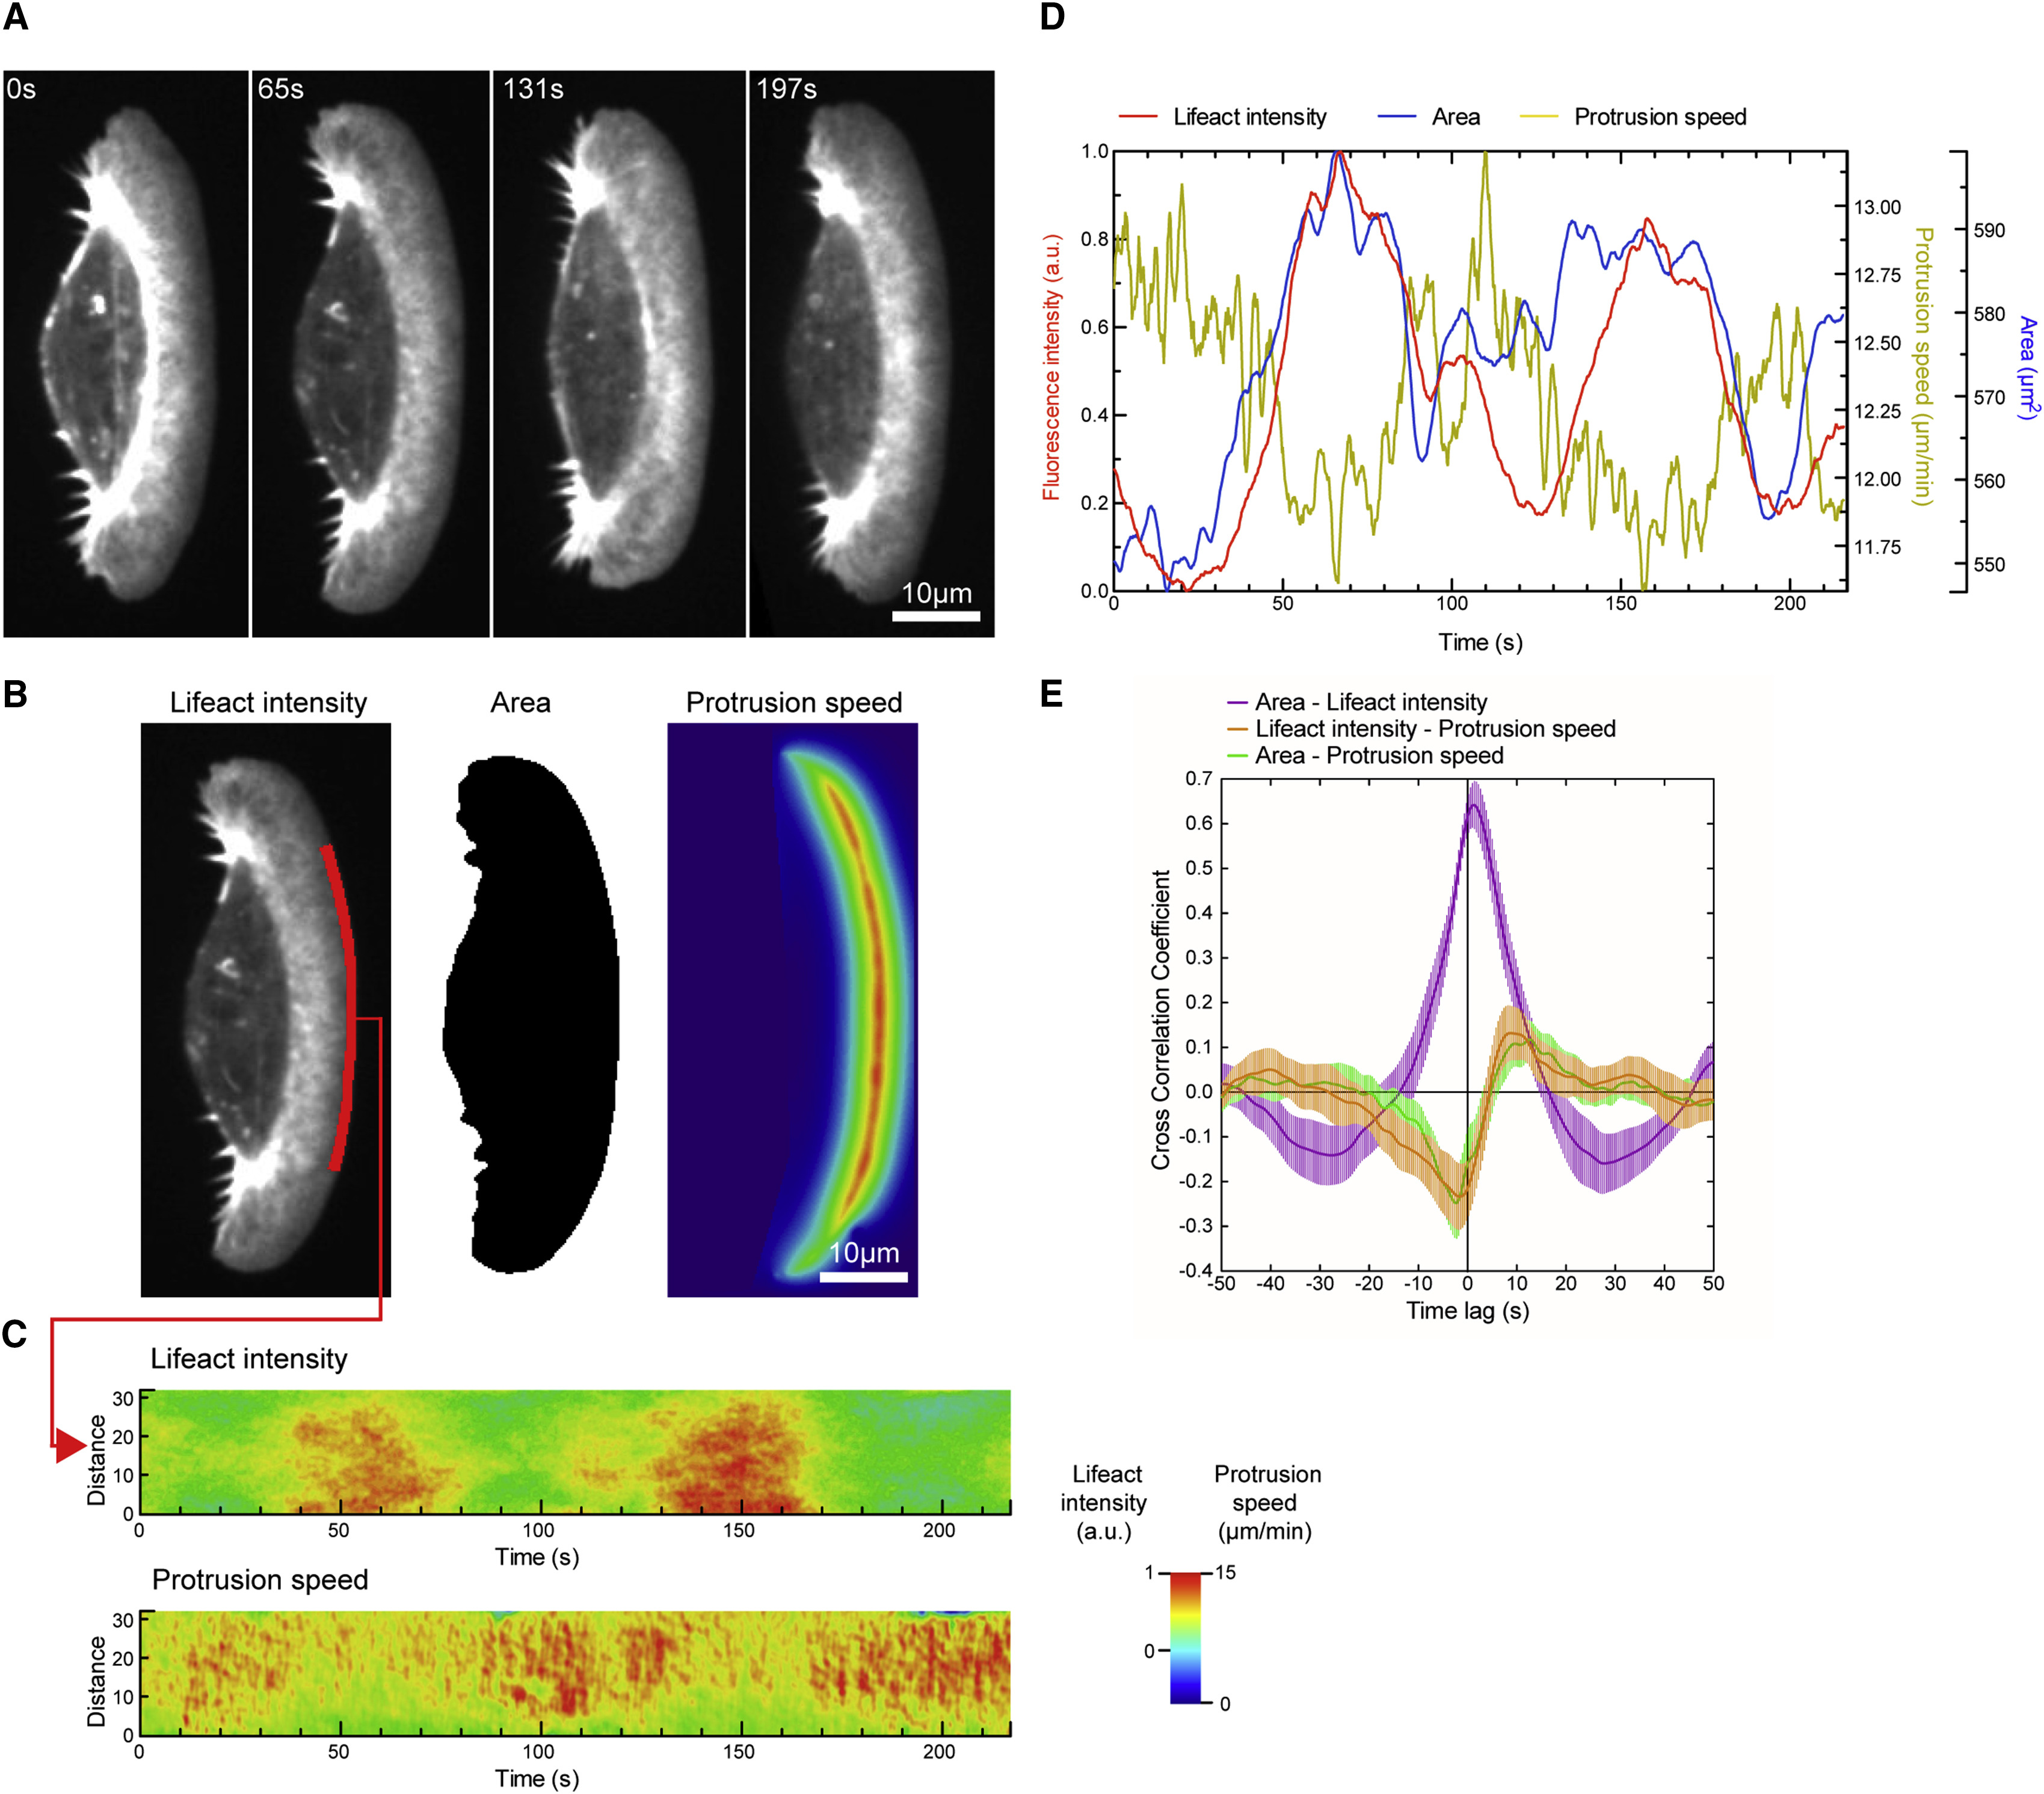
(A) Confocal imaging of lifeact:GFP-expressing keratocyte moving on a glass coverslip.
(B) Time frame from (A) showing the 1.09-μm wide area of lifeact:GFP intensity measurements (left), a binary mask used for quantifying the area (middle), and a pseudo-colored Horn-Schunck optical flow analysis image of the leading edge (right).
(C) Fluorescence intensity and leading edge velocity maps for the time lapse of the cell shown in (A).
(D) Temporal fluctuations of cell area, lifeact:GFP intensity, and protrusion speed averaged across the analyzed region shown in red in (B).
(E) Average of temporal cross-correlation functions of 21 migrating keratocytes. Mean and SEM are shown.
See also Figures S1 and S2 and Movie S1.
Reprinted from Cell, 171, Mueller, J., Szep, G., Nemethova, M., de Vries, I., Lieber, A.D., Winkler, C., Kruse, K., Small, J.V., Schmeiser, C., Keren, K., Hauschild, R., Sixt, M., Load Adaptation of Lamellipodial Actin Networks, 188-200.e16, Copyright (2017) with permission from Elsevier. Full text @ Cell