
- Title
-
Patterned Arrangements of Olfactory Receptor Gene Expression in Zebrafish are Established by Radial Movement of Specified Olfactory Sensory Neurons
- Authors
- Bayramli, X., Kocagöz, Y., Sakizli, U., Fuss, S.H.
- Source
- Full text @ Sci. Rep.
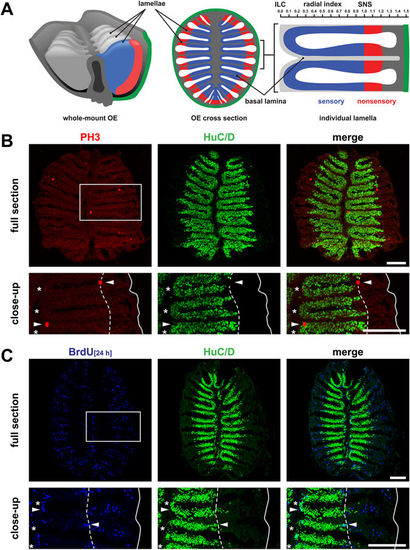
Cell proliferation in the adult zebrafish olfactory epithelium. (A) Schematic overview of the zebrafish OE, which forms by repeated folding of the epithelial sheet to give rise to double-faced radial lamellae. The sensory epithelium of neighbouring lamellae is continuous at the interlamellar curves (ILCs) and joined at the basal lamina. Olfactory sensory neurons are restricted to the inner region (blue) sharply separated from respiratory cells in the peripheral nonsensory OE (red) at the sensory/nonsensory border (SNS). The radial index (top, right) depicts the scale for morphometric measurements of cell positions normalized to the length between the tip of ILCs and the position of the SNS. (B) Immunohistochemistry against the mitotic marker phospho-histone H3 (PH3, red, left) and the pan-neuronal marker HuC/D (green, centre) on full sections through the adult zebrafish OE (top) and higher power view of one side of the OE (bottom) indicated by the grey box. Mitotically active cells (arrowheads) occur at the ILCs (asterisks) and SNS (dotted line). The solid line depicts the outline of the section. Scale bars: 100 µm. (C) Immunohistochemistry against BrdU (blue, left) after 24 h BrdU incubation to label dividing cells and HuC/D (green, centre) to visualize mature neurons on full sections (top) and higher power views of one side of the OE (bottom) indicated by the grey box. BrdU-positive cells are restricted to the ILCs (asterisks) and SNS (dotted line) but are completely absent from the center of the sensory OE. BrdU/HuC/D double-positive cells occur at the edge of the sensory OE (arrowheads). Scale bars: 100 µm. EXPRESSION / LABELING:
|

Adult-born cells invade the sensory epithelium over time. (A) Immunohistochemistry against BrdU following 24 h BrdU incubation 1d (left), 4d (centre), and 21d post labelling on sections through the adult OE. The dotted line indicates the position of the sensory/nonsensory border and the solid line demarcates the outline of the section. BrdU-positive cells are located at the interlamellar curves (centre of the sections) and peripherally to the sensory/nonsensory border initially but progressively invade the sensory OE. Scale bars: 100 µm. (B) Reconstructions of surface views onto a standardized olfactory lamella as shown in Fig. 1A 1d (left), 4d (centre), and 21d (right) following BrdU incubation for 24 h. The radial positions of BrdU-positive cells (left to right) were normalized to the maximum radius of the OE (radial distance) and plotted individually for each of 25 to 26 consecutive sections from the dorsal (top) to the ventral (bottom) margin of the OE. The circumference of the OE is indicated by a solid white line, the dotted line demarcates the average position of the SNS from all lamellae on the respective section. The frequency of BrdU-positive cells within each bin was normalized to the total number of BrdU-positive cells per section (max). The image has been smoothened with a bicubic scaling function. For a representation of unprocessed data see Supplementary Figure 2. (C) Frequency distributions of BrdU-positive cells 1d (left), 4d (centre), and 21d (right) following 24 h BrdU incubation. The position of labelled cells was normalized to the distance of the sensory/nonsensory border (SNS) from the tip of the interlamellar curves (ILCs). The dotted line demarcates the position of the SNS. Data points represent means ± SEM for 14.365 (1d), 10.967, (4d), and 7.463 (21d) cells from 30 sections of 3 OE for each time point. BrdU-positive cells originating from the ILC and SNS progressively invade the sensory OE over time, while cells in the periphery of the OE remain stationary. An additional population of non-migratory cells becomes visible at the ILC for the 21d time point. |
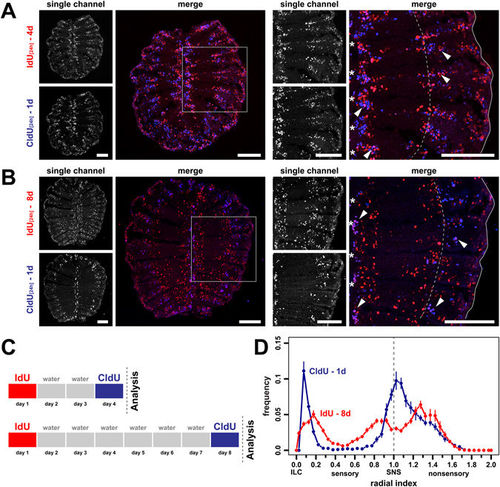
Simultaneous labeling of old and young cell populations in the same olfactory epithelium. (A) Cross sections through the OE of fish that were incubated with IdU (red) for 24 h followed by a second 24 h incubation with CldU (blue) two days later. Single channel exposures are shown to the left, the merged channels to the right. The panel on the right shows a higher power view of one side of the OE indicated by the grey box on the left. Single IdU- and CldU-positive cells as well as double positive cells (pink, arrowheads) can be detected. The younger CldU-positive and CldU/IdU double positive cells are confined to the interlamellar curves (asterisks) and regions peripheral to the sensory/nonsensory border (dotted line). The older single IdU-positive cells occupy more central positions in the sensory OE. Scale bars: 100 µm. (B) Same experiment as in A. but with a 6d time interval between consecutive labelling with IdU and CldU. IdU single-positive cells advanced further from the ILC and SNS towards the centre of the sensory epithelium. Scale bars: 100 µm. (C) Schematic representation of the experimental setup for A. (top) and B. (bottom). (D) Frequency distributions of IdU- (red) and CldU (blue) single-positive cells from the 8d experiment shown in B. The positions of cells were normalized to the length of the sensory OE between the interlamellar curves (ILCs) and the sensory/nonsensory brder (SNS). The dotted line indicates the position of the SNS. The older IdU-labeled cells show a broader, more central distribution than the younger CldU-positive cells that are concentrated at the ILC and SNS. The graph represents the positions of 4.787 IdU-positive and 3.778 CldU-positive cells from 20 sections of 2 fish, mean ± SEM. |

Neurogenesis is restricted to the central and peripheral edge of the sensory neuroepithelium. (A) In situ-hybridization for the early neurogenesis markers achaete scute-like 1a (ascl1a) and delta-like a (dla), and the late differentiation markers neuronal differentiation 4 (neurod4) and growth associated protein 43 (gap43) on full cross sections through the adult OE (top) and higher power views of one side of the OE (bottom). Expression of the neurogenic markers is restricted to the interlamellar curves (asterisks) and sensory/nonsensory border (dotted line). The solid line indicates the outline of the section. Scale bars: 100 µm (top panel), 50 µm (bottom panel). (B) Ascl1a-expressing cells are actively dividing. In situ hybridization for ascl1a (red) and immunohistochemistry against BrdU following 24 h incubation with the marker to highlight dividing cells. Double positive cells (arrowheads) can be identified at the interlamellar curves (asterisks) and the sensory/nonsensory border (dotted line). Scale bar: 50 µm. (C) Quantification of the distribution of cells expressing the neurogenic markers ascl1a, dla, and neurod4 at the interlamellar curves (ILC) and sensory nonsensory border (SNS; means ± SEM for ascl1: 8 sections from 2 fish, dla: 9 sections from 3 fish, neurod4: 8 sections from 2 fish). Cells expressing the markers are unevenly distributed between the two proliferation zones; more ascl1a- and dla-expressing cells can be found at the SNS, whereas more neurod4-positive cells locate to the ILC. (D) Immunohistochemistry against the mitotic marker proliferating cell nuclear antigen (PCNA, green) and the neuronal stem cell marker sox2 (red) on a single whole mount olfactory lamella. Two rows of dividing cells can be identified in the peripheral nonsensory OE, cells at the inner band (arrows) are double positive for sox2 and appear yellow, while dividing cells in the peripheral OE (arrowheads) are devoid of sox2 expression. Note that most of the double-positive dividing cells at the interlamellar curve (left end of the lamella) are not included due to the dissection of the lamella. EXPRESSION / LABELING:
|
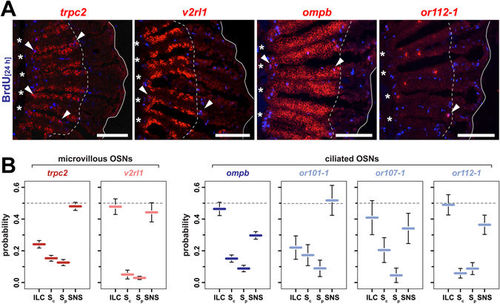
Functional equivalence and bias in OSN neurogenesis at the ILC and SNS. (A) In situ-hybridization (red) for markers of distinct OSN subtypes and immunohistochemistry against BrdU (blue) at 8d (trpc2, ompb) and 4d (v2rl1, or112-1) following 24 h BrdU incubation. The trpc2 gene is expressed by all microvillous OSNs, a larger subset of which also expresses the vomeronasal receptor v2rl1. Ciliated OSNs label positive for ompb and express specific olfactory receptor genes, such as or112-1. For each gene, double-positive cells (arrowheads) can be found at the interlamellar curves (asterisks) and the sensory/nonsensory border (dotted line). The solid line demarcates the outline of the section of which only one half is shown. Scale bars: 100 µm. (B) Quantification of OSN subtype neurogenesis at different proliferation sites. The sensory OE was subdivided into four equal segments (ILC: interlamellar curves, Sc: sensory central, Sp: sensory peripheral, SNS: sensory/nonsensory border) and the occurrence of marker/BrdU double-positive OSNs was scored for each segment for the general microvillous marker trpc2 (red), the vomeronasal-like receptor v2rl1 (light red), the ciliated OSN marker ompb (blue) and the three classical OR genes or101-1, or107-1, and or112-1 (light blue) expressed by ciliated OSNs. A subtype-specific bias exists for neurogenesis at the ILC and SNS. Data represent the mean ± SEM; trpc2: 607 cells from 5 OE; v2rl1: 203 cells from 4 OE; ompb: 563 cells from 2 OE; or101-1: 35 cells from 6 OE; or107: 25 cells from 7 OE; and or112-1: 76 cells from 8 OE. EXPRESSION / LABELING:
|
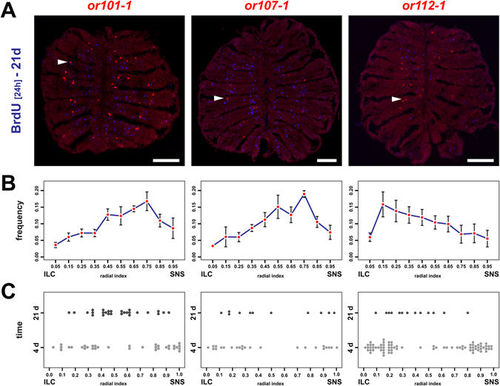
OSNs continue to undergo positional shifts after onset of OR expression. (A) Immunohistochemistry against BrdU (blue) on cross sections through the OE of adult zebrafish that were incubated for 24 h in BrdU 21d prior to analysis and simultaneous in situ-hybridization (red) for the three olfactory receptors or101-1 (left), or107-1 (centre), and or112-1 (right). For each receptor BrdU double-positive cells (arrowheads) can be identified. Scale bar: 100 µm. (B) OR frequency distribution profiles across the radial dimension of the OE for the receptors shown in A (left: or101-1, centre: or107-1, right: or112-1). The position of each cell was normalized to the distance of the sensory/nonsensory border (SNS) from the tips of the interlamellar curves (ILCs). The data represent the positions (mean ± SEM) of: or101-1: 755 cells from 4 OEs of 4 fish, or107-1: 332 cells from 4 OEs of 4 fish, and or112-1: 464 cells from 6 OEs of 3 fish. (C) Spatial distribution of young (4d, light grey) and old (21d, dark grey) OSNs expressing or101-1 (left), or 107-1 (centre), and or112-1 (right) normalized to the length of the sensory OE between the tips of the interlamellar curves (ILCs) and the sensory/nonsensory border (SNS). OSNs expressing specific OR genes continue to undergo positional shifts over time. EXPRESSION / LABELING:
|

Cell death in the zebrafish OE. (A) Immunohistochemistry against BrdU and HuC/D and survival curve of BrdU/HuC double-positive OSNs (top; mean ± SEM; top) following 24 h incubation with BrdU. The data points after the initial increase of double positive cells between 2d and 4d can be fitted with the exponential function #cells = 387.5e−0.035 X, which corresponds to an OSN half life of t1/2 = 19.8 d. (n = 2d: 17, 4d: 26, 8d: 18, 30d: 51, and 90d: 60 sections). Representative cross sections for the 4d (left) and 90d (right) time point are shown (bottom). BrdU/HuC double-positive cells (turquoise, arrowheads) are more numerous at earlier time points and undergo positional shifts towards the centre of the sensory OE. (B) Detection of cell death in the adult zebrafish OE by terminal deoxynucleotidyl transferase dUTP nick end labeling (TUNEL) of fragmented DNA on cross sections though the OEs of two different zebrafish (bottom). TUNEL-positive cells appear dark brown by chromogenic detection with 3,3′-diaminobenzidine. The images represent composites of two high-resolution pictures joined together at indicated positions (dotted lines) to cover the full sections. The frequency distribution of TUNEL-positive cells along the radial dimension of the sensory region of the OE is shown in the top graph. The position of cells has been normalized to the distance of the sensory/nonsensory border (SNS) from the tip of the interlamellar curve (ILC). TUNEL-positive cells can be found throughout the entire sensory OE but are unevenly distributed and more abundant in the vicinity of the ILC and in the centre of the sensory OE. The data points represent the means ± SEM of the distribution of 689 cells from 9 sections of 3 fish. Scale bars: 100 µm. |

Apoptotic cell death in the adult zebrafish olfactory epithelium. A. Immunohistochemistry against the apoptotic marker cleaved caspase 3 (casp3, green, left) and the pan-neuronal marker HuC/D (red, centre) on full sections (top panel) and higher power views (bottom panel) of the intact zebrafish OE. Only occasional caspase 3-positive cells (arrowheads) can be detected. Scale bars: 100 μm. B. Immunohistochemistry against the apoptotic marker cleaved caspase 3 (casp3, green, left and the pan-neuronal marker HuC/D (red, centre) on full sections (top panel) and higher power view (bottom panel) of the adult zebrafish OE 4 h after chemical lesion by nasal irrigation with 1% Triton X-100 for 90 s. Induction of caspase 3 activity is restricted to regions of the OE in which OSNs have been successfully damaged, indicated by the loss of HuC/D immunoreactivity (dotted lines). Scale bars: 100 μm. |