
- Title
-
Distinct functions of two olfactory marker protein genes derived from teleost-specific whole genome duplication
- Authors
- Suzuki, H., Nikaido, M., Hagino-Yamagishi, K., Okada, N.
- Source
- Full text @ BMC Evol. Biol.

Expression patterns of OMP1 and 2 at the tissue level. a RT-PCR analysis of OMP1, OMP2, and GAPDH (positive control) in adult zebrafish. DNA templates were as follows: B, brain; OE, olfactory epithelium; E, eye; G, gill; S, skin; T, testis; O, ovary; Gen, genomic DNA. RT–, the cDNA synthesis was performed without reverse transcriptase as a negative control for RT-PCR of OMP1. Note: When genomic DNA was used as a tmplates, PCR using OMP2 or GAPDH primers did not amplified fragments because of the presence of introns (over 2 kb) in the corresponding sequences in the genomic DNA. b Expression of OMP genes in eyes of gar and zebrafish. Bars indicate FPKM ratio of each OMP to Gαt1, which is coupling with rhodopsins. The number of spotted gar indicate technical replicate. c, d Fluorescence in situ hybridization analysis for OMP2 using DIG-labeled antisense riboprobes (c) or sense riboprobes (d) in transverse sections of adult zebrafish eyes, which were counterstained with DAPI. GCL, ganglion cell layer; IPL, inner plexiform layer; INL, inner nuclear layer; OPL, outer plexiform layer; ONL, outer nuclear layer. Arrow indicates OMP2-expressing zone. Scale bar, 50 µm EXPRESSION / LABELING:
|

Expression patterns of OMP1 and 2 at the cellular level in the OE. Two-color fluorescence in situ hybridization analysis using DIG- or fluorescein-labeled antisense riboprobes in horizontal sections of the adult zebrafish OE. a, d, g Fluorescent images of Alexa 594 derived from DIG-labeled riboprobes. b, e, h Fluorescent images of Alexa 488 derived from fluorescein-labeled riboprobes. c, f, i Merged images of (a) and (b), (d) and (e), and (g) and (h), respectively. Yellow two-headed arrows and cyan two-headed arrows indicate the superficial layer and the deep layer, respectively. Dashed lines indicate the outlines of the epithelium. White arrowheads indicate cells that coexpress OMP2 and another gene. Scale bar, 20 µm EXPRESSION / LABELING:
|

Coexpression of OMP2 and G± families. Two-color fluorescence in situ hybridization analysis using DIG- or fluorescein-labeled antisense riboprobes in horizontal sections of the adult zebrafish OE. a, d, g Fluorescent images of Alexa 594 derived from DIG-labeled riboprobes. b, e, h Fluorescent images of Alexa 488 derived from fluorescein-labeled riboprobes. c, f, i Merged images of (a) and (b), (d) and (e), and (g) and (h), respectively. Yellow two-headed arrows and cyan two-headed arrows indicate the superficial layer and the deep layer, respectively. Dashed lines indicate the outlines of the epithelium. White arrowheads indicate cells that coexpress OMP2 and another gene. Scale bar, 20 µm EXPRESSION / LABELING:
|

Expression patterns of OMP1 and TRPC2. Two-color fluorescence in situ hybridization analysis using DIG- or fluorescein-labeled antisense riboprobes in horizontal sections of adult zebrafish OE. (A) Fluorescent images of Alexa 594 derived from DIG-labeled riboprobes. (B) Fluorescent images of Alexa 488 derived from fluorescein-labeled riboprobes. (C) Merged image of A and B. Yellow two-headed arrows and cyan two-headed arrows indicate the superficial layer and the deep layer, respectively. Dashed lines indicate the outlines of the epithelium. White arrows indicate OMP1-expressing cells in the superficial layer. Scale bar, 20 µm. EXPRESSION / LABELING:
|

Expression patterns of Gαolf2 and Gαo2. EXPRESSION / LABELING:
|
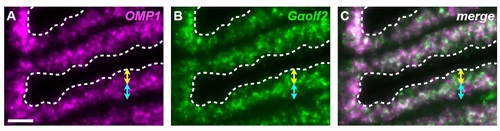
Expression patterns of OMP1 and Gαolf2. Two-color fluorescence in situ hybridization analysis using DIG- or fluorescein-labeled antisense riboprobes in horizontal sections of adult zebrafish OE. Scale bar, 20 µm. (A) Fluorescent images of Alexa 594 derived from DIG-labeled riboprobes. (B) Fluorescent images of Alexa 488 derived from fluorescein-labeled riboprobes. (C) Merged image of A and B. Yellow two-headed arrows and cyan two-headed arrows indicate the superficial layer and the deep layer, respectively. Dashed lines indicate the outlines of the epithelium. Scale bar, 20 µm. EXPRESSION / LABELING:
|
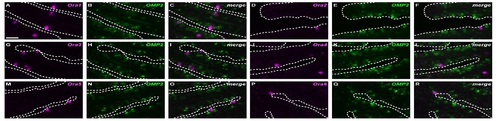
Expression patterns of OMP2 and Ora genes. Two-color fluorescence in situ hybridization analysis using DIG- or fluorescein-labeled antisense riboprobes in horizontal sections of adult zebrafish OE. (A,D,G,J,M,P) Fluorescent images of Alexa 594 derived from DIG-labeled riboprobes. (B,E,H,K,N,Q) Fluorescent images of Alexa 488 derived from fluorescein-labeled riboprobes. (C,F,I,L,O,R) Merged images of A and B, D and E, G and H, J and K, M and N, and P and Q, respectively. Dashed lines indicate the outlines of the epithelium. Scale bar, 20 µm. EXPRESSION / LABELING:
|