
IMAGE
Fig. S4
Image
|
Figure Caption
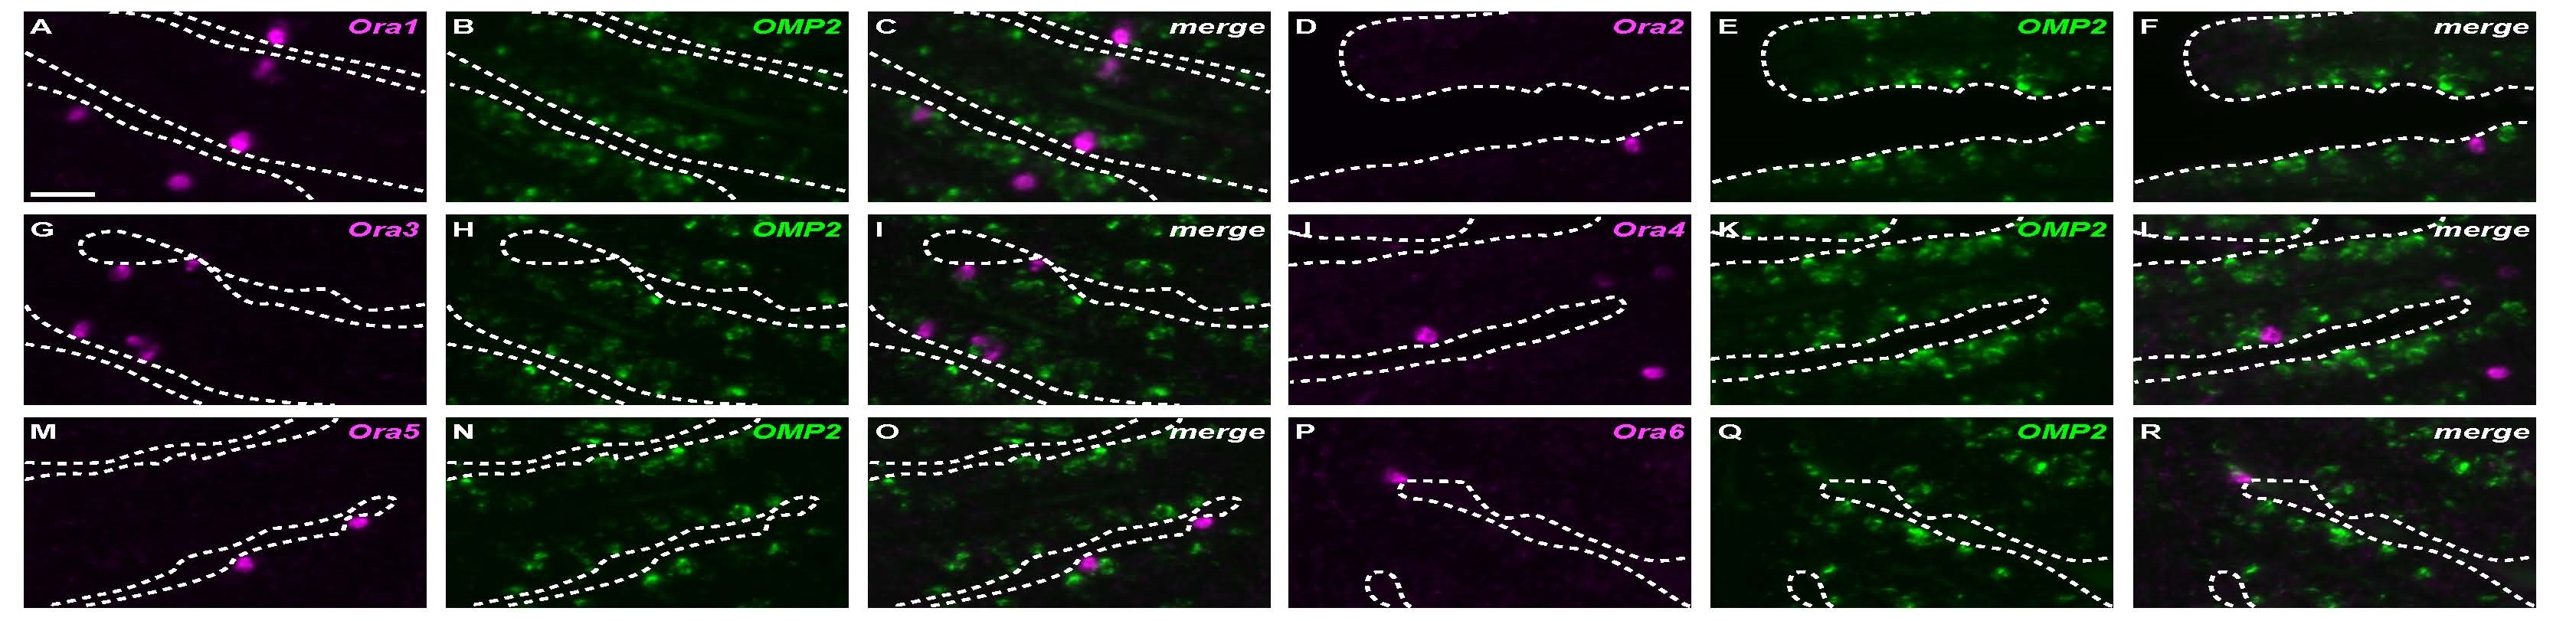
Fig. S4
Expression patterns of OMP2 and Ora genes. Two-color fluorescence in situ hybridization analysis using DIG- or fluorescein-labeled antisense riboprobes in horizontal sections of adult zebrafish OE. (A,D,G,J,M,P) Fluorescent images of Alexa 594 derived from DIG-labeled riboprobes. (B,E,H,K,N,Q) Fluorescent images of Alexa 488 derived from fluorescein-labeled riboprobes. (C,F,I,L,O,R) Merged images of A and B, D and E, G and H, J and K, M and N, and P and Q, respectively. Dashed lines indicate the outlines of the epithelium. Scale bar, 20 µm.
Figure Data
Acknowledgments
This image is the copyrighted work of the attributed author or publisher, and
ZFIN has permission only to display this image to its users.
Additional permissions should be obtained from the applicable author or publisher of the image.
Full text @ BMC Evol. Biol.