
|
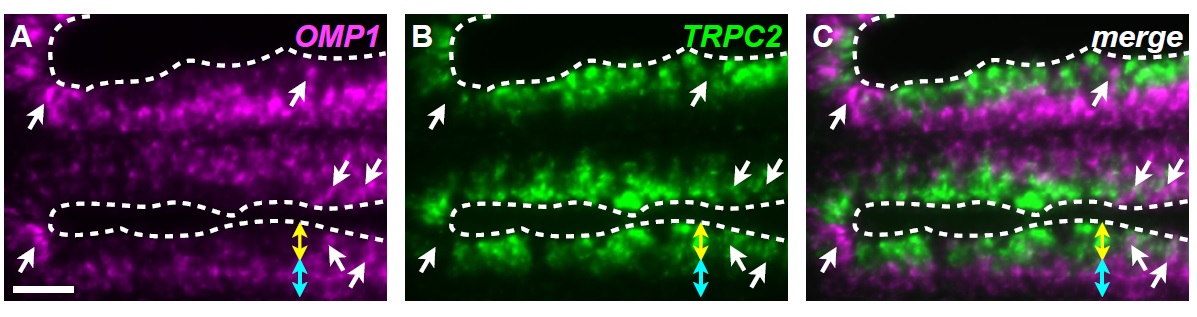
Fig. S1
Expression patterns of OMP1 and TRPC2. Two-color fluorescence in situ hybridization analysis using DIG- or fluorescein-labeled antisense riboprobes in horizontal sections of adult zebrafish OE. (A) Fluorescent images of Alexa 594 derived from DIG-labeled riboprobes. (B) Fluorescent images of Alexa 488 derived from fluorescein-labeled riboprobes. (C) Merged image of A and B. Yellow two-headed arrows and cyan two-headed arrows indicate the superficial layer and the deep layer, respectively. Dashed lines indicate the outlines of the epithelium. White arrows indicate OMP1-expressing cells in the superficial layer. Scale bar, 20 µm.