
- Title
-
Calcineurin regulates coordinated outgrowth of zebrafish regenerating fins
- Authors
- Kujawski, S., Lin, W., Kitte, F., Börmel, M., Fuchs, S., Arulmozhivarman, G., Vogt, S., Theil, D., Zhang, Y., Antos, C.L.
- Source
- Full text @ Dev. Cell

Treatment with FK506 Enhances Regenerative Outgrowth of Adult Caudal Fin (A and D) Caudal fins of adult fish before treatments. (B and E) Amputated adult fins pretreatment. (C) DMSO-treated regenerated fin 28 days postamputation (dpa). (F) FK506-treated regenerated fin 28 dpa. (G) Graphed measurements of DMSO-, FK506-treated fish from the base of the fin to the tip of the mouth shows no significant differences between each treatment group before and after 70 days of treatments of adult fish with regenerating caudal fins. (H) Graph of fin growth rates during DMSO and FK506 treatments normalized to body length. Arrow indicates the time point when control fins reach their original size and return to isometric growth. Arrowhead indicates the time point where differences in growth rate become apparent. (I) Whole-mount in situ hybridization experiments (ISH) for fkbp1Aa expression of 3 dpa regenerating fin. (I2) Magnification of box in (I). (J) Cross-section through regenerating fin 3 dpa shows strong expression of fkbp1Aa in the blastema and weak expression in epidermis. (K) Expression of fkbp10 in a 3 dpa fin. (K2) Magnification of box in (K). (L) Cross-section through regenerating fin 3 dpa shows expression of fkbp10 in the blastema. (M) Expression of fkbp14 in 3 dpa fin. (M2) Magnification of box in (M). (N) Cross-section through regenerating fin 3 dpa shows expression of fkbp14 in the blastema. (O) qRT-PCR results comparing difference in fold expression of regeneration-associated genes for FK506- over DMSO-treated fins. The dashed line shows baseline expression in DMSO-treated fish, and the black bars show average increased fold expression of each gene in FK506- over DMSO-treated fins. In (G) and (H), data are represented as mean ± SD of three experiments each with five or more animals. In (I)–(N), each panel represents in situ results of two or more fins from three or more experiments. In (O), each point represents qRT-PCR experiments of a cDNA pool of eight harvested fins. Scale bars, 1 mm (A–F), 200 μm (I, I2, K, K2, M, and M2), and 20 µm (J, L, and N). |
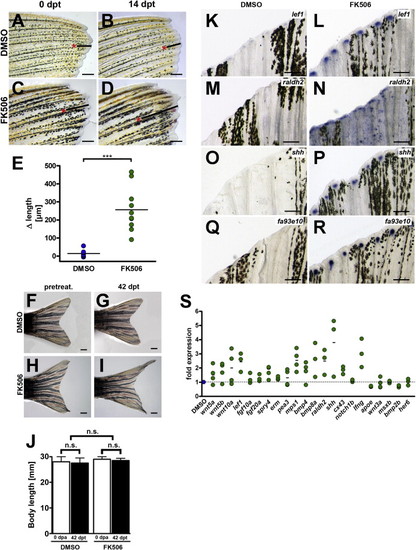
FK506 Treatment of Uninjured Adult Fish Induces Allometric Growth of the Fin (A and B) Adult caudal fin (A) before DMSO treatment at 0 days posttreatment (dpt) and (B) after DMSO treatment for 14 days. (C and D) Fin (C) before FK506 treatment and (D) after treatment with FK506 14 dpt. (E) Graph of DMSO- and FK506-treated fin measurements at 14 dpt. p < 0.005. (F and H) Caudal fins before treatment. (G) Same adult fin in (F) after 42 dpt with DMSO. (I) Same adult fin in (H) after 42 dpt with FK506. (J) Graph shows no significant differences in body lengths before and after 42 days of treatment either with DMSO or FK506. (K) ISH for lef1 in DMSO-treated fin at 5 dpt. (L) lef1 ISH in FK506-treated fin at 5 dpt. (M) ISH for raldh2 expression in DMSO-treated fin at 5 dpt. (N) ISH for raldh2 expression in FK506-treated fin 5 dpt. (O) ISH for shh expression in DMSO-treated fin at 5 dpt. (P) ISH for shh expression in FK506-treated fin at 5 dpt. (Q) ISH for fa93e10 expression in DMSO-treated fin 5 dpt. (R) ISH for fa93e10 expression in FK506-treated fin 5 dpt. (S) qRT-PCR results showing differences in fold gene expression of FK506-treated over DMSO-treated fins at 14 dpt. Asterisks in (A)–(D) demarcate the same segment before and after treatments, and lines indicate length of measurement. In (E) and (S), each point represents qRT-PCR result from a cDNA pool of eight fins. In (K)–(R), each panel represents in situ results of two or more fins from three or more experiments. Scale bars, 0.1 mm (A–D and F–I) and 200 μm (K–R). |
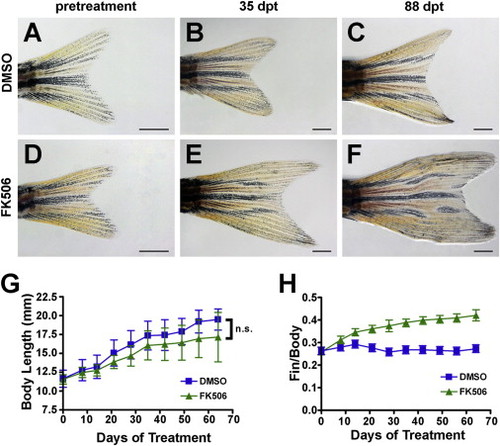
Treatment with FK506 Enhances Outgrowth of the Developing Juvenile Fin (A) Caudal fin of a juvenile fish at 30 days postfertilization (dpf). (B) Fin of the same 65 dpf fish in (A) after DMSO treatment for 35 days. (C) Adult fin of fish 118 dpf after DMSO treatment for 88 days. (D) Caudal fin of a juvenile fish 30 dpf before FK506 treatment. (E) Fin of same fish 65 dpf after FK506 treatment for 35 days. (F) Caudal fin of fish 118 dpf after FK506 treatment for 88 days. (G) Body length measurements of treated juvenile fish during growth. Regression lines for slopes are 0.0025 fin/body ratio per day for FK506 treated and 0.00018 fin/body ratio per day for DMSO control. (H) Graph shows growth as fin-to-body ratio of treatment groups. Scale bars, 500 μm (A–F). In (G) and (H), data are represented as mean ± SD from two experiments each containing six or more animals. |
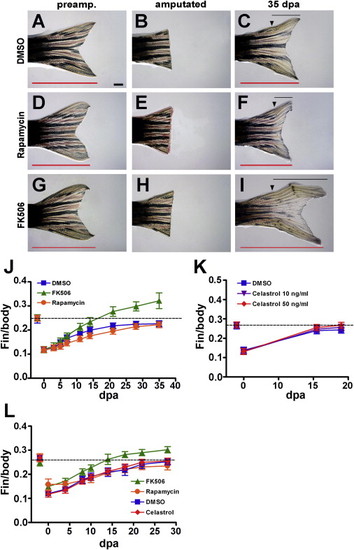
FK506-Enhanced Regenerative Outgrowth Is Not Due to Immunosuppression (A, D, and G) Caudal fins before treatments and amputation. (B, E, and H) Corresponding amputated adult fins pretreatment. (C) DMSO-treated regenerated fin at 35 dpa. (F) Rapamycin-treated regenerated fin 35 dpa. (I) FK506-treated regenerated fin at 35 dpa. (J) Graph of fin-to-body length ratios during the course of regeneration. Dashed line indicates original fin-to-body-length ratio. (K) Fin-to-body length ratio measurements during the regeneration time course of DMSO- and Celastrol-treated fish. (L) Fin-to-body-length measurements during regeneration time course from fish injected with DMSO, FK506, rapamycin, or Celastrol. In (C), (F), and (I), black arrowheads mark the amputation planes. Black lines show the extent of regenerative outgrowth and red lines highlight the length of the entire caudal fin. Scale bars, 1 mm (A–I). In (J)–(L), data are represented as mean ± SD from two or more experiments containing six or more animals. |

A Calcineurin-Mediated Mechanism Regulates Growth (A) Adult caudal fin before amputation and DMSO treatment. (B) Amputated fin at 0 days dpa. (C) DMSO-treated fin at 38 dpa. (D) Adult fin before amputation and FK506 treatment. (E) Amputated fin at 0 dpa. (F) FK506-treated fin at 38 dpa. (G) Adult fin before amputation and cyclosporin A (CsA) treatment. (H) Amputated fin at 0 dpa. (I) CsA-treated fin at 38 dpa. (J) Graph of the fin-to-body ratios for DMSO-, FK506-, and CsA-treated fish. (K) Percentage of calcineurin activity normalized to DMSO in DMSO-, FK506-, and CsA-treated regenerating fins at 7 dpa. (L) ISH of calcineurin catalytic subunit in 5 dpa regenerating fins. (L2) Magnification of regenerating rays in (L). (M) Cross-section of adult caudal fin shows strong expression of calcineurin in the blastema and weak expression in the epidermis. (N) Fold change in calcineurin activity normalized to unamputated fins at different time points during regenerative outgrowth of the caudal fin of wild-type fish. p values given only for significance values of 0.05 or less. In (C), (F), and (I), black arrowheads mark the amputation planes. Black lines show the extent of regenerative outgrowth, and red lines highlight the length of the entire caudal fin. Scale bars, 1 mm (A–I), 200 μm (L and L2), and 20 μm (M). Data are represented as mean ± SD from three or more experiments with six or more animals. |

Calcineurin Inhibitors Promote Proximal Growth Program (A) DMSO-treated fin 28 days after ventral proximal and dorsal distal cuts (red lines indicate growth). (B) FK506-treated fin 28 days after ventral proximal and dorsal distal cuts (red lines indicate growth). (C) Early growth rates of DMSO-treated regenerating caudal fin lobes after proximal or distal amputation. (D) Early growth rates of FK506-treated regenerating caudal fin lobes after proximal or distal amputation. (E) Regeneration profiles of DMSO-treated fins amputated proximally or distally. (F) Regeneration profiles of FK506-treated fins amputated proximally or distally. (G) Adult caudal fin before amputation. (H) DMSO-treated fin 28 dpa. (I) Caudal fin before amputation. (J) FK506-treated fin at 28 dpa. In (G)–(J), red lines show length to ray bifurcation (dashed black line). (K) Quantification of the measurements of rays from the base to the bifurcation points in (G)–(J). (L) Graph shows the difference in the shift in bifurcation between DMSO- and FK506-treated caudal fins at 28 dpa. (M) Whole-mount ISH for shh in distal cut DMSO-treated regenerating fin at 14 dpa. (N) ISH for shh in proximally amputated fin at 12 dpa. (O) shh expression domain in distally cut regenerating FK506-treated fins at 12 dpa. (P) shh domain of during regeneration of FK506-treated proximally cut fin at 12 dpa. (Q) Length of shh expression domains in proximal and distal amputated DMSO- and FK506-treated fins at 12 dpa. (R) Length of bmp8a expression domains in proximal and distal amputated DMSO- and FK506-treated fins at 12 dpa. Scale bars, 2 mm (A and B) and 200 μm (G–J and M–P). Data are represented as mean ± SD from three experiments containing six or more animals (C–F, K, L, Q, and R). p values are results from unpaired t test (K, L, Q, and R). |

Calcineurin Inhibitors Regulate the Endogenous Retinoic Acid Program (A) qRT-PCR comparing genes regulating retinoic acid in 28 dpa regenerating FK506-treated fins to values of DMSO-treated regenerating fins. (B) qRT-PCR of the same genes comparing values of regenerating CsA-treated fins to values of regenerating DMSO control fins at 28 dpa. (C–H) ISH at 5 dpa for raldh2 of DMSO (C) and FK506-treated fins (D); for cyp26a1 of DMSO (E) and FK506-treated fins (F); for crapb2b in DMSO (G) and FK506-treated fins (H). (I) qRT-PCR for agr2 comparing values of FK506-treated fins to DMSO-treated fins at 28 dpa. (J and K) agr2 ISH in 3 dpa DMSO (J) and FK506 (K) fins. Red lines in (J2) and (K2) show proximodistal range of agr2 staining. (L and M) Cross-sections of in situs for agr2 on regenerating fins after DMSO- (L) and FK506- (M) treated fins. (N) qRT-PCR for retinoic acid regulating genes comparing values of FK506-treated unamputated fins to DMSO-treated unamputated fins at 5 dpt. (O and P) raldh2 ISH for unamputated 5 dpt DMSO (O) and FK506-treated fins (P). (Q and R) rarγ expression in unamputated fins 5 dpt with DMSO (Q) or with FK506 (R). (S) qRT-PCR for rarγ expression comparing values from 5 dpt FK506-treated unamputated fins to values of DMSO-treated fins. (T) qRT-PCR for agr2 expression comparing values from 5 dpt FK506-treated unamputated fins to values of DMSO-treated fins. (U and V) agr2 ISH of unamputated fins at 5 dpt for DMSO (U) and FK506 (V). (U2 and V2) Enlarged fin images of indicated unpigmented find in (U) and (V), respectively. Blue arrows indicate agr2 in situ staining. Black arrowhead indicates pigment cell at the border of the enlarged panel (V). (W and X) Cross-sections of in situs for agr2 on unamputated fins after DMSO- (W) and FK506- (X) treated fins. In (A), (B), (I), (N), (S), and (T), each point represents qRT-PCR experiments of a cDNA pool of eight harvested fins. In (C)–(H), (J)–(M), (O)–(R), and (U)–(X), each panel represents in situ results of two or more fins from three or more experiments. Scale bars, 200 μm (C–H, J, K, and Q–V), 25 μm (L, M, W, and X), and 100 μm (O and P). |

FK506 treatment enhances regenerative growth of fins, related to Figure 1. (A,B) Regenerated adult DMSO-treated (A) and FK506-treated (B) caudal fins at 28 dpa showing the points of reference (base of fin and amputation plane) used to determine changes in length proximal to the amputation plane (determined by change in bone morphology and thickness of pigmentation stripes at the amputation border between the residual stump and regenerated tissue, black arrowhead). (C) Graph of measurements from different fish (n = 6) per treatment group. (D) Regenerating anal fin of adult fish 28 days post DMSO treatment and amputation. (E) Regenerating anal fin of adult fish treated 28 days post FK506 treatment and amputation. (F) Regenerating dorsal fin of adult fish 28 days post treatment with DMSO. (G) Regenerating dorsal fin of adult fish 28 days post treatment with FK506. (H) Graph of fin-to-body ratios of anal and dorsal fins from both treatments (n = 6 per treatment group). All graphs show mean +/- SD. p values determined by Students’s T-test. Arrowheads indicated plane of amputation. (A-G) Scale bars equal 1mm (A,B) and 2 mm (D-G). |
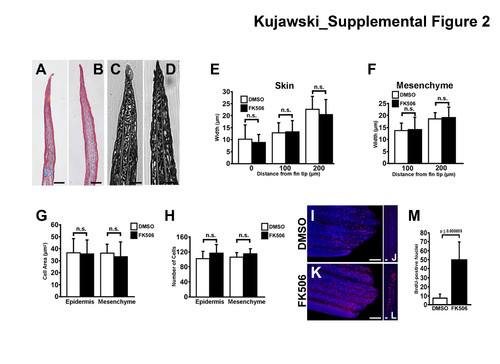
Treatment with a calcineurin inhibitor does not result in disproportionate growth between tissues, related to Figure 1. (A) Masson’s Trichrome-stained cross section through a bony ray of a DMSO-treated 7 dpa regenerating fin. (B) Masson’s Trichromestained cross section through a bony ray of a FK506-treated 7 dpa regenerating fin. (C) Higher magnification of Toluene blue-stained section of a distal regenerating tip of DMSOtreated fins at 7 dpa. (D) Higher magnification of Toluene blue-stained section of a distal regeneration tip of FK506-treated fins at 7 dpa. (E) Graphed measurements of the epidermal thickness (width) from bone to outer surfaces at the 0, 100 and 200 µm from the distal tip of DMSO- and FK506-treated regenerating fins at 7 dpa. (F) Graph of the thickness (width) of the central mesenchymal compartment between bone hemirays at 100 and 200 μm from the distal tips of DMSO- and FK506-treated regenerating fins at 7 dpa. (G) Graph of area measurements of several cells (n = 6) in the wound epidermis and blastema of DMSO- and FK506-treated fins. (H) Graph of the number of cells from the distal tip to 200 μm in the wound epidermis and blastema of DMSO-and FK506-treated fins. (I) BrdU-incorporation (red) in DAPI-stained (blue) fin treated with DMSO for 42 days. (J) Cross section of BrdU– labeled (red) in DAPI-stained (blue) fin. (K) BrdU-incorporation (red) in DAPI-stained (blue) fin treated with FK506 for 42 days. (L) Cross section of BrdU-labeled (red) in DAPI-stained (blue) fin. (M) Graph of BrdU measurements of BrdU-positive nuclei observed from cross sections. (n = 3 caudal fins per treatment group, and 3 different section locations per fin). p values determined by Students’s T-test. Scale bars are 2 mm (A,B); 400 μm (C,D) (I,K) 100 μm and (J,L) 20 μm. (E-H,M) Data are represented as mean +/- SD. |

Inhibition of FKBPs does not reproduce FK506-enhanced regenerative outgrowth phenotype, related to Figure 5. (A) Regenerating DMSO-treated caudal fin 42 dpa. (B) Regenerating FK506-treated caudal fin 42 dpa. (C) Regenerating SLF-treated caudal fin 42 dpa. (D) Graph of the fin-length-to-body-length measurements over time from caudal fins of the different treatment groups. Data represented as mean +/- SD. In (A-C), arrowheads denote the level of amputation and red lines present the length of the whole fin. Scale bar (AC) is 2 mm. |

Induction of RA signaling components by calcineurin inhibition, related to Figure 7. (A) Expression of raldh2 in 5 dpa regenerating DMSO-treated caudal fin. (B) Elevated expression of raldh2 expression in 5 dpa regenerating CsA-treated caudal fin. (C) crabp2b expression in DMSO-treated 5 dpa fin. (D) crabp2b expression in CsA-treated 5 dpa caudal fin. (E) Cross section of in situ staining for agr2 shows punctate pattern in skin. (E′) Magnified regenerating fin cross section of the agr2 in situ 3 dpa. (F) Giemsa staining of cross sections through adult caudal fin of a DMSO-treated fish shows a few glands at the surface of the skin (black arrow). (G) Giemsa staining of cross sections through adult caudal fin of FK506-treated fish shows increased number of glands in the skin (black arrows) (H) Graph of averages from measured number of glands of unamputated (uninjured) and amputated fins in different treatment groups. (n = 5 caudal fins per treatment group, and 4 different section locations per fin) Data shows mean +/- SD. p values determined by Students’s T-test. (A-D) Scale bar equal to 200 μm, (E) 50 μm, and (E′-G) 25 μm. |
Reprinted from Developmental Cell, 28, Kujawski, S., Lin, W., Kitte, F., Börmel, M., Fuchs, S., Arulmozhivarman, G., Vogt, S., Theil, D., Zhang, Y., Antos, C.L., Calcineurin regulates coordinated outgrowth of zebrafish regenerating fins, 573-87, Copyright (2014) with permission from Elsevier. Full text @ Dev. Cell