
- Title
-
Telomerase is required for zebrafish lifespan
- Authors
- Henriques, C.M., Carneiro, M.C., Tenente, I.M., Jacinto, A., and Ferreira, M.G.
- Source
- Full text @ PLoS Genet.
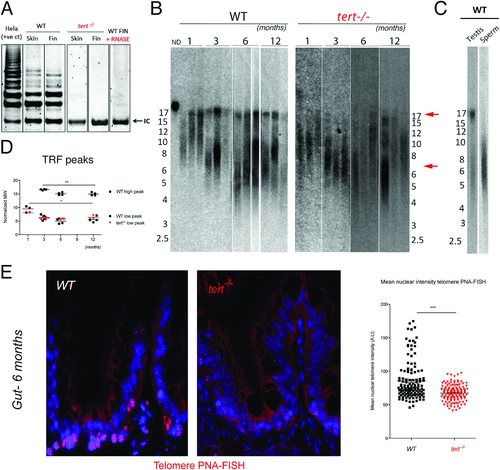
Telomerase mutant zebrafish have shorter telomeres than WT siblings. A) Representative image of TRAP assay showing that telomerase is not active in the tert-/- zebrafish, as compared to tert+/+ siblings. Here shown are caudal fin and skin protein extracts. Hela cell extract is shown as positive control. N = 4. B) Representative image of restriction fragment analysis of caudal fin genomic DNA of 3 different individuals at different ages, by southern blot (random primer-labelled telomeric probe (CCCTAA)12 32P-dCTP). tert+/+ Zebrafish have heterogeneous telomeres, with two distinct peaks of different lengths. In tert+/+ the highest peak (~16 Kb, top red arrow) becomes more distinct after 1 months of age and decreases in length over-time (B and D). The lowest peak of telomere intensity also decreases in length (bottom red arrow, B and D). tert-/- zebrafish have shorter telomeres than tert+/+ siblings in different tissues (see also Figure S1A and S1B), observed by the decrease in length of the higher TRF peak. The shortest TRF peaks accompany those of tert+/+ siblings, and decrease over-time at similar rates. C) Testes fractionation in tert+/+ reveals the two-telomere length populations in whole testes, whereas mature sperm only shows the shorter TRF smear of about 6 Kb, suggesting different telomere lengths in different cells within a tissue. D) TRF mean sizes were calculated as described in [50]. E) Telomere PNA-FISH in 6-month-old gut tissue shows cells with different telomere intensities in the wild type, mainly localizing to the proliferative niche. In contrast tert-/- mutants display cells with less bright and more homogeneous telomere intensity. PHENOTYPE:
|
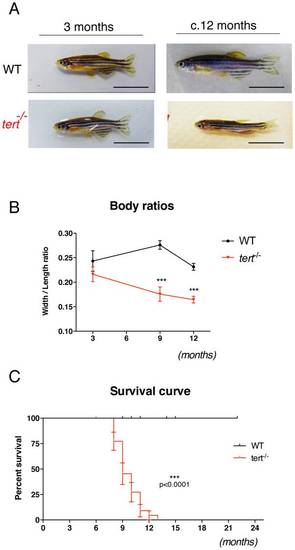
First-generation telomerase mutant zebrafish show progressive body wasting and die prematurely. A) Representative images of tert+/+ and tert-/- zebrafish show that tert-/- fish are born and develop normally until reproductive maturity at ~3 months of age, but progressively lose body mass since then, B) represented as an overall reduction in width/length ratios as compared to wild-type siblings N≥6 p<0.001. This progressive wasting phenotype is accompanied by increase in mortality. C) Kaplan-Meier curve showing that tert-/- zebrafish have significantly reduced survival when compared to tert+/+ siblings (AVG lifespan 9 versus >22 months (p<0.005)). N = 24 tert-/-; N = 45 tert+/+. Data are represented as mean +/- SEM. Scale bar = 1 cm. PHENOTYPE:
|
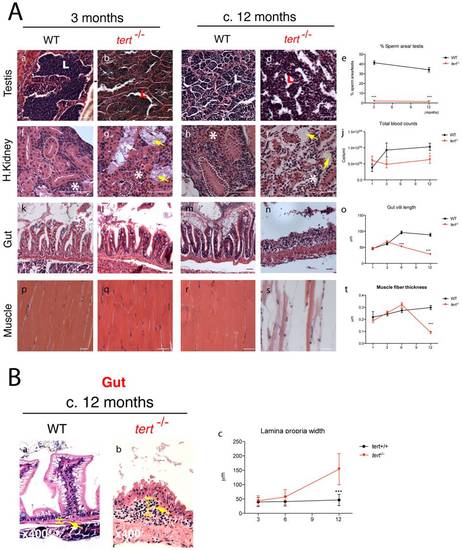
Telomerase depletion leads to a time- and tissue-dependent degeneration. A) Representative images of tissue sections of tert-/- Zebrafish and tert+/+ siblings, stained with hematoxilin-eosin. tert-/- zebrafish show progressive tissue deterioration. Severe histological abnormalities are first evident in proliferative tissues (testes, gut and head kidney marrow) and later in non-proliferative (muscle). tert-/- Zebrafish show reduced sperm in testes lumen (L) (Ab and d; p<0.001). The head kidney shows progressive defects in the marrow area (white asterisks) (Ag and i, which correlates with a decrease in total blood (p = 0.0228) cells when compared to tert+/+ siblings from an early age (3 months, Ne5) (Aj). Mesonephric tubules in the head kidney also degenerate in tert-/- (Ag and i dashed outlines). Gut atrophy in tert-/-, reflected as decreased villi length (Al, n, o), becomes significant from the age of 6 months (p<0.001). Muscle fibres are significantly thinner (p<0.001) at terminal time-points (c.12 months) (Aq, s, t, dashed outline); N≥5. B) tert-/- display progressive thickening of gut lamina propria, indicative of inflammation (Bb, c, yellow bar and arrow, Ne4). Data are represented as mean +/- SEM. Scale bar = 50 μm. PHENOTYPE:
|
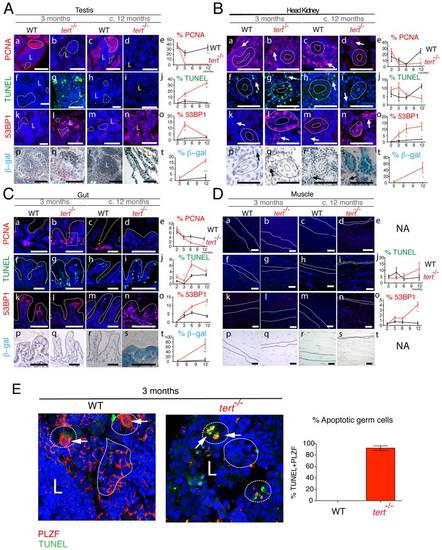
Proliferative tissue degeneration is accompanied by a sustained decrease in proliferation, acute apoptotic responses, and progressive accumulation of DDR foci. Representative immunofluorescence images of tissue sections in F1 tert-/- and tert+/+ zebrafish show levels of proliferation (PCNA), apoptosis (TUNEL), DNA damage (53BP1) and senescence-associated β–galactosidase at the ages of 3 to c.12 months. Proliferative tissues such as A) testes, B) head kidney and C) gut sections show sustained significant decrease in proliferation in tert-/- as compared to tert+/+ siblings (panels b, d and e) (p<0.001) and an acute apoptotic response at 3 months of age (p<0.001), which clears by c. 12 months (panels g, i and j). This is accompanied by a progressive increase in 53BP1 foci, reaching maximum significance at c. 12 months (panels l, n and o; p<0.001). This coincides with the presence of senescence-associated β –galactosidase at c.12 months (panels s and t). Note in the testes that most of apoptosis (TUNEL) seems to localize to the spermatogenic zone (Ag, dashed outline) and panel E, where we see an increase in TUNEL-labelled germ cells, labelled with the specific marker PLZF. Most of DNA damage (53BP1) locates to the proliferative zone of maturing spermatocytes (Al, uniform outline). Note in the head kidney B), both the proliferative haematopoietic tissue (Ba–d, arrows) and the non-proliferative mesonephric tubule epithelium (Ba–d, dashed outline) are affected by increased apoptosis (Bg, I, j), DNA damage (Bl, n and o) and senescence (Bs and t) in the tert-/-. D) Muscle, a largely non-proliferative tissue (Da–d) shows significant accumulation of DNA damage foci at in tert-/- by the age of c.12 months (Dn and o; p<0.001), when the muscle fibres are already atrophic (Dn, dashed outline). Quantifications were performed in at least 3 different fields of view of at least 3 different individuals of each genotype at the different time-points indicated in the graphs. Gut IF quantifications were calculated as number of positive cells per “crypt” zone (C) uniform square outline exemplified). Other tissues′ IF was quantified as overall % positive cells. β-galactosidase was quantified as % area stained blue, per field of view. Data are represented as mean +/- SEM. Scale bar = 50 ;mu;m. EXPRESSION / LABELING:
PHENOTYPE:
|
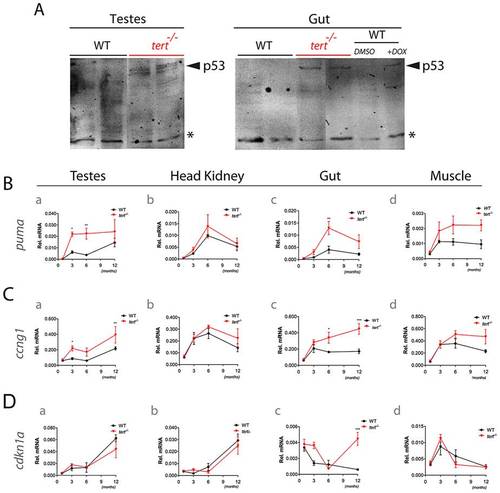
Tissue degeneration is accompanied by p53 induction with a puma acute response and sustained increase of cyclin G1 and cdkn1a expression. A) Immunoblot analysis of p53 in 10-month old WT and tert-/- testes and gut lysates. 6 month-old WT zebrafish were injected with the DNA damaging agent doxorubicin to serve as positive control for p53 activation. Asterisk depicts a non-specific cross-reactive band that serves as loading control. RT-qPCR analysis showing expression of B) pro-apoptotic (puma) and cell cycle arrest targets (C) cyclin G1 and D) cdkn1a) in testes, head kidney, gut and muscle of 1, 3, 6 and c.12 months old WT and tert-/- zebrafish (N = 3 to 8 fish per genotype). Data are represented as mean +/- SEM. Rel. mRNA refers to relative mRNA levels of each gene normalized to beta-actin. EXPRESSION / LABELING:
PHENOTYPE:
|
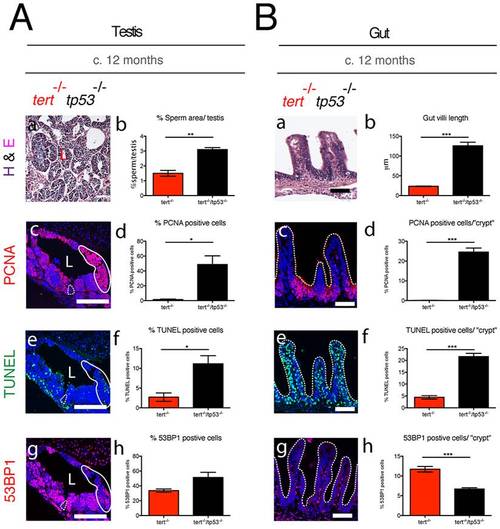
Elimination of tp53 function partially rescues tert-/- degeneration in proliferative tissues. tert-/-tp53-/- show increased proliferation and apoptosis in both testes (Ac, d and e, f) and gut (Bc, d and e, f), as compared to tert-/- alone. In the testis, dashed outline represents spermatogenic zone, uniform outline proliferative zone of maturing spermatocytes and L the lumen where mature sperm is located. Elimination of tp53 function partially rescues mature sperm numbers (Aa, b) but completely rescues gut villi length (Ba, b). DNA damage as assessed by 53BP1 is maintained in tert-/-tp53-/- testes (Ag and h) and decreased in the gut (Bg and h), as compared to tert-/-. N≥3. Data are represented as mean +/- SEM. Scale bar = 50 μm. PHENOTYPE:
|
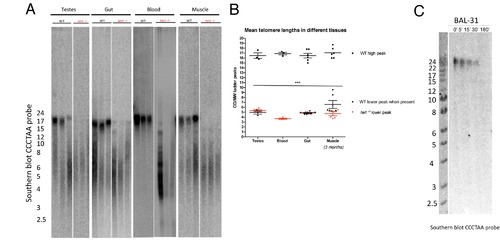
tert-/- zebrafish have shorter telomeres than tert+/+ in all tissues tested. A) Representative southern blots and TRF analysis of different tissues at the age of 3 months, show decreased telomere sizes in tert-/- as compared to tert+/+ siblings. Note that all tissues have both long and short TRF populations in the tert+/+, except the blood, where only a long TRF of approximately 15 Kb is detected. tert-/- show a severe decrease of these long telomeres, and mainly show the short TRF smear of approximately 6 Kb. B) Mean TRF peak quantifications of the southern blot shown in A). C) Representative southern blot and TRF analysis of Bal31 (a 5′ and 3′ terminal exonuclease) restriction of fin genomic DNA shows that all telomeric signals correspond to terminal sequences. Ne3. Data are represented as mean +/- SEM. |
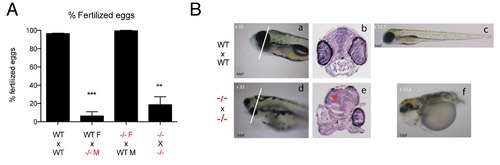
First generation tert-/- show premature male infertility. A) tert-/- mutant males are infertile by 6 months of age, represented here as percentage of non-fertilized eggs per cross (Mean nr. of non-fertilized eggs/total number of eggs produced by the female). Number of crosses = 3. B). The few F1 maternal zygotic progeny are not viable due to gross abnormalities during embryonic development. N≥3. Data are represented as mean +/- SEM. |
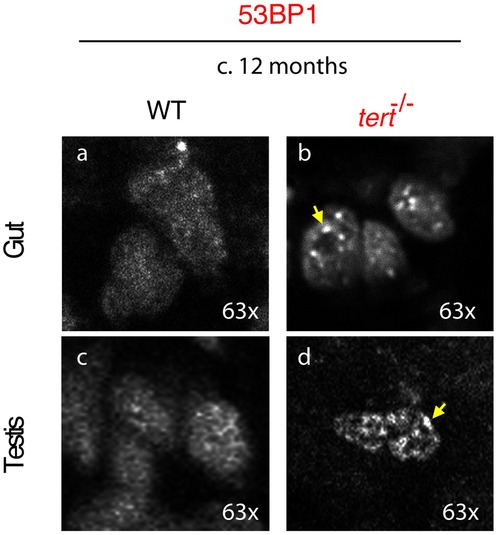
tert-/- proliferative tissues accumulate strong 53BP1 foci. Panel showing representative images of cells in testis and gut of wild-type and tert-/- fish at c.12 months of age. tert-/- tissues accumulate cells presenting strong 53BP1 foci, as highlighted by the yellow arrows, compared to a more diffuse 53BP1 staining in most wild-type cells. |

Unillustrated author statements PHENOTYPE:
|