
|
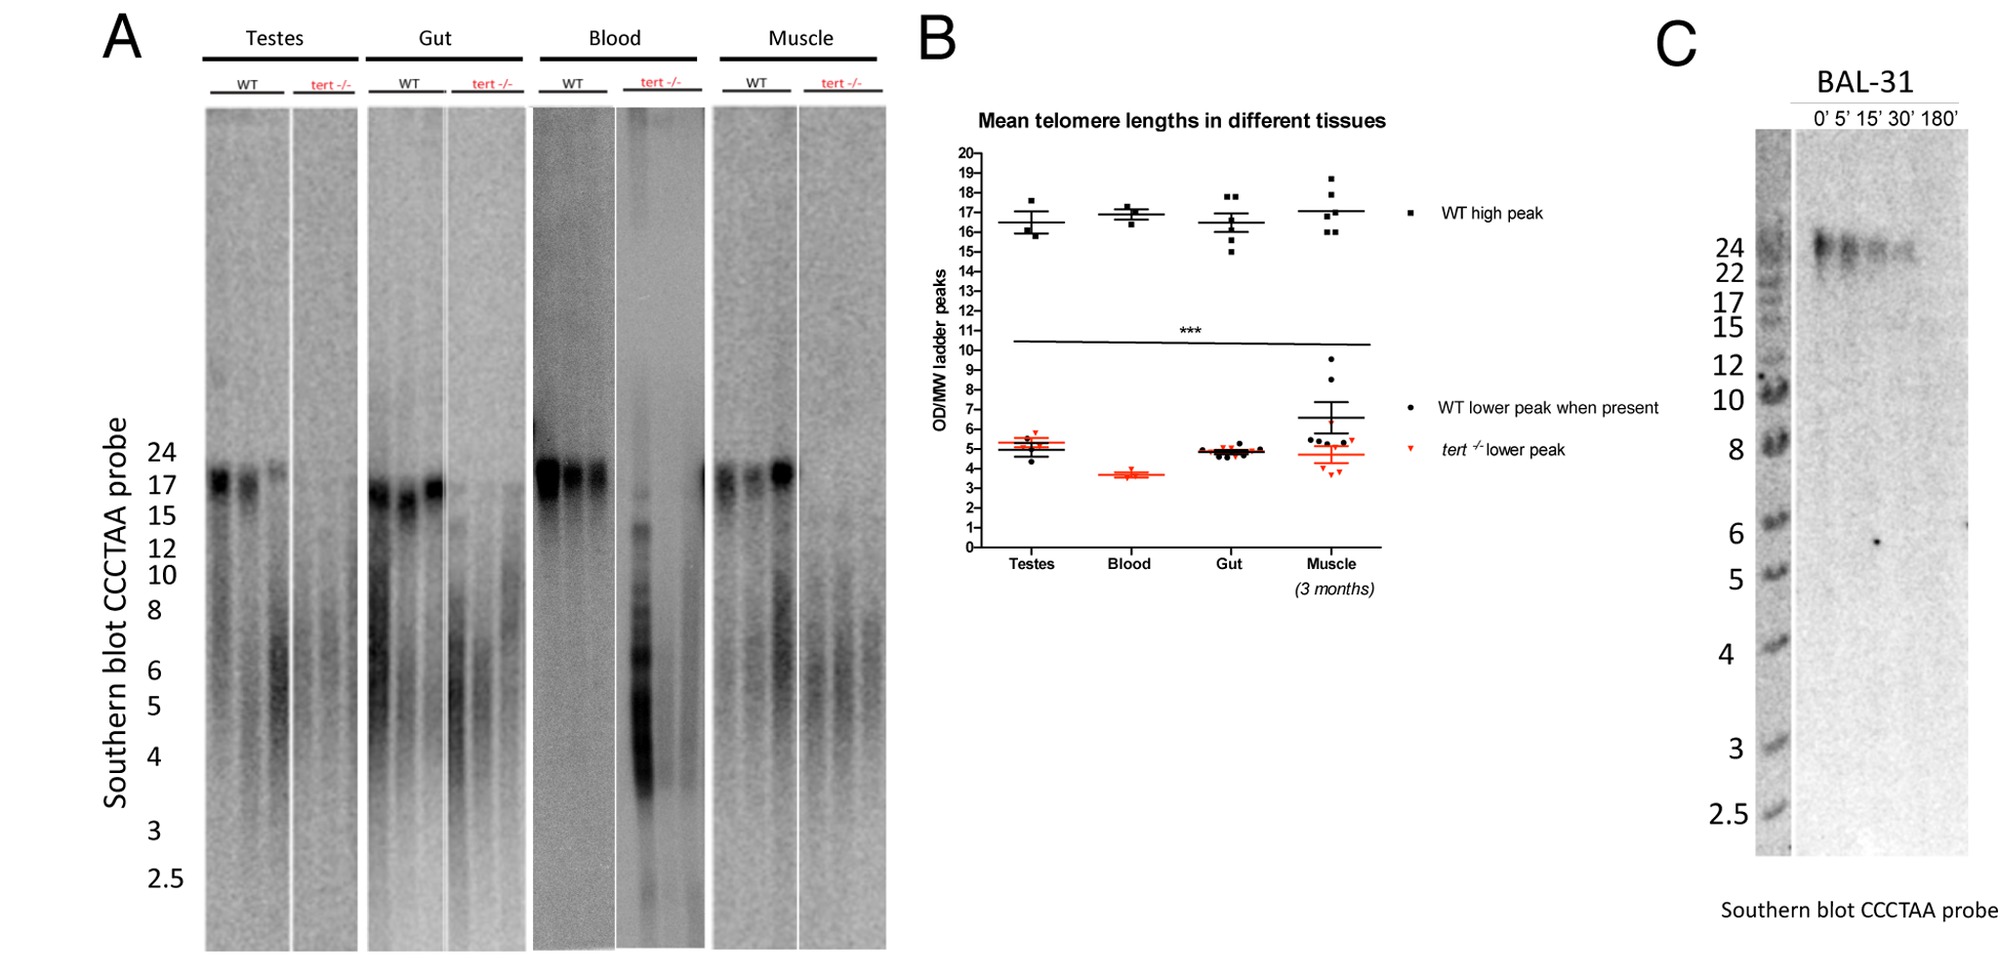
Fig. S1 tert-/- zebrafish have shorter telomeres than tert+/+ in all tissues tested. A) Representative southern blots and TRF analysis of different tissues at the age of 3 months, show decreased telomere sizes in tert-/- as compared to tert+/+ siblings. Note that all tissues have both long and short TRF populations in the tert+/+, except the blood, where only a long TRF of approximately 15 Kb is detected. tert-/- show a severe decrease of these long telomeres, and mainly show the short TRF smear of approximately 6 Kb. B) Mean TRF peak quantifications of the southern blot shown in A). C) Representative southern blot and TRF analysis of Bal31 (a 5′ and 3′ terminal exonuclease) restriction of fin genomic DNA shows that all telomeric signals correspond to terminal sequences. Ne3. Data are represented as mean +/- SEM.