
- Title
-
Ciliated sensory hair cell formation and function require the F-BAR protein syndapin I and the WH2 domain-based actin nucleator Cobl
- Authors
- Schuler, S., Hauptmann, J., Perner, B., Kessels, M.M., Englert, C., and Qualmann, B.
- Source
- Full text @ J. Cell Sci.
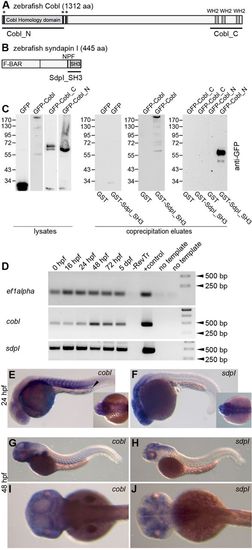
Biochemical interaction and expression of zebrafish Cobl and syndapin I. (A) Domain structure of zebrafish Cobl (JQ776648) with Cobl homology domain, three KrRAPpPP motifs (asterisks) and three WH2 domains. Black lines represent deletion mutants used in the present study. (B) Domain structure of zebrafish syndapin I and a deletion mutant used. NPF, Asn-Pro-Phe motif. (C) Co-precipitation experiments with zebrafish Cobl and N- and C-terminal fragments thereof (Cobl_N, Cobl_C) expressed as GFP-fusion proteins and immobilized, recombinant GST-syndapin I SH3 domain (GST-SdpI_SH3) and GST, respectively, analyzed by anti-GFP immunoblotting of cell lysates (input) and eluates. (D) Expression levels of cobl and syndapin I (sdpI) at 0hpf to 5dpf analyzed by RT-PCR. –RevTr, without reverse transcriptase. (E–J) Tissue-specific expression patterns of cobl (E,G,I) and syndapin I (F,H,J) analyzed by in situ hybridization at 24hpf (E, F) and 48hpf (G–J). Insets in E and F show dorsal head views. Cobl and syndapin I are expressed in neuronal tissues. Cobl expression was additionally detected in somites (especially at 24hpf; E) and the pronephros (arrowhead in E). |

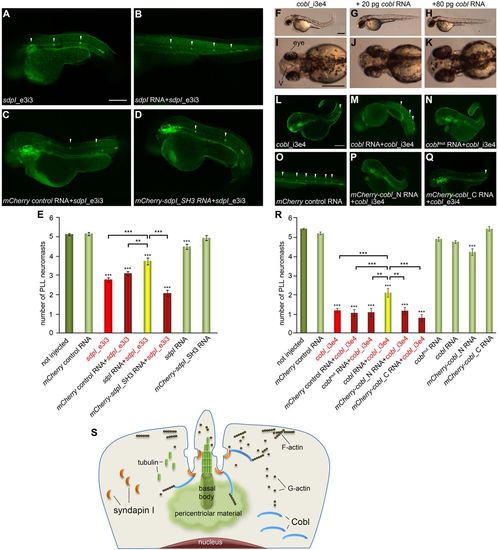
MO-mediated knock-down of cobl and syndapin I leads to similar defects in brain, body and motile cilia-driven body laterality development. (A,B) Position of MOs for cobl (A) and syndapin I (B) on the respective genes (ORF in white; UTRs in grey). MO cobl_i3e4 and MO cobl_e4i4 prevent correct splicing (A). For syndapin I, an ATG-targeting and a splice-preventing MO (sdpI_e3i3) were designed (B). (C,D) Knock-down of cobl (C) and syndapin I (D) using increasing amounts of the splice-preventing MOs cobl_i3e4, cobl_e4i4 and sdpI_e3i3 validated via RT-PCR using whole-body mRNA at 24h post injection and at the 16 somite stage for MO cobl_i3e4; ef1alpha amplification was used for normalization. n.t., no template. (E–J) Cobl- and syndapin I-morphant embryos show similar phenotypes at 24hpf (E,G) and 48hpf (H,J). Note the shortened anterior–posterior body axes, heart (arrowheads) and brain with oedema (asterisks) and increased ventricle sizes (examples marked), and smaller heads and eyes. (L,M) Double knock-down of cobl and syndapin I leads to dramatically enhanced phenotypes (L, 24hpf; M, 48hpf) (embryos not dechorionated). Scale bars: 250μm. fb, forebrain; mhb, midbrain-hindbrain boundary; nc, notochord; v, ventricle. (K) Quantitative analysis of lengths of the body axis at 24hpf. Wild-type, n = 18; MO p53, n = 9; MO sdpI_ATG, n = 12; MO sdpI_e3i3, n = 15; MO cobl_i3e4, n = 20; MO cobl_e4i4, n = 7. Statistical analyses, ANOVA with Tukey’s test versus wild-type. **P<0.01, ***P<0.001. (N,O) Cobl and syndapin I morphants display impaired laterality formation (in situ hybridization of pitx2 (arrowheads); exemplary images underscoring quantification of pitx2 distribution in wild-type, control-injected (p53) and morphant embryos at 20–22 somite stages). Wild-type, n = 174; MO p53, n = 47; MO sdpI_ATG, n = 42; MO sdpI_e3i3, n = 42; MO cobl_i3e4, n = 67. EXPRESSION / LABELING:
|

Cobl and syndapin I morphants are paralyzed or display uncoordinated movements and fail to keep their balance. (A–C) Dechorionated control-injected embryos (48hpf) show typical directed escape responses after tactile stimulation (A), whereas syndapin I (B) and cobl (C) morphants did not respond or moved in an uncoordinated spinning manner. The swim paths of moving fish (numbered) are depicted. Note that both cobl- and syndapin I-morphant fish also often lie on their side. Scale bars: 5mm. (D) Quantification of the percentage of fish showing uncoordinated spinning behavior [control-injected (MO p53), n = 28; MO sdpI_ATG, n = 18; MO cobl_i3e4, n = 77 animals]. (E) Quantitative analysis of balance keeping after tactile stimulation. SdpI- and cobl-morphant embryos lie on their sides and fail to orientate upright (MO p53, n = 10; MO sdpI_ATG, n = 40; MO cobl_i3e4, n = 24; two independent experiments at 48 hpf). PHENOTYPE:
|
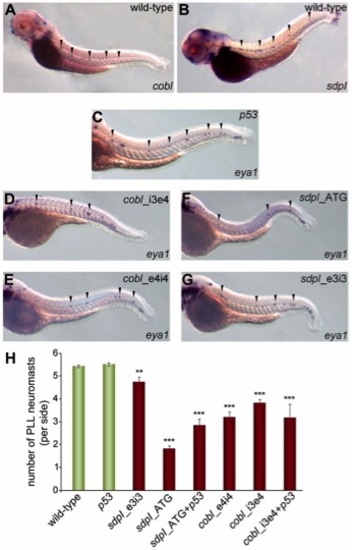
Knock-down of either cobl or syndapin I diminishes neuromasts of the posterior lateral line organ. (A,B) Wild-type zebrafish (72hpf) analyzed for cobl and syndapin I expression patterns by in situ hybridization. Arrowheads mark regular arrays of cobl- and syndapin I-positive spots in the tails. (C–G) In situ hybridization of eya1 (neuromast marker) at 48hpf. Neuromasts at the facing tail side are marked by arrowheads. (D–G) Knock-down of cobl (D,E) and syndapin I (F,G) leads to reduced neuromast numbers. (H) Quantitative analysis. Wild-type, n = 117; MO p53, n = 55; MO sdpI_e3i3, n = 27; MO sdpI_ATG, n = 58; MOs sdpI_ATG+p53, n = 17; MO cobl_e4i4, n = 16; MO cobl_i3e4, n = 48; MOs cobl_i3e4+p53, n = 26. ANOVA with Tukey’s test versus MO p53; **P<0.01 for MO sdpI_e3i3 and ***P<0.001 for all other data sets. PLL, posterior lateral line. EXPRESSION / LABELING:
PHENOTYPE:
|
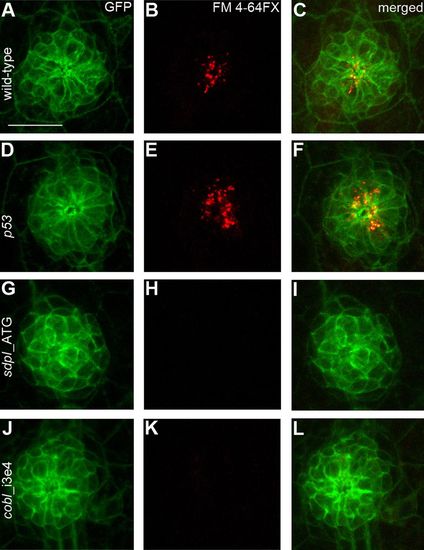
Sensory hair cells within neuromasts of both cobl- and syndapin I-morphant zebrafish larvae are not functional. (A,D,G,J) Confocal images of representative posterior lateral line neuromasts of wild-type, p53-, sdpI- and cobl-morphant transgenic claudinB:lyn(GFP) larvae at 4dpf. Hair cells are organized symmetrically in rosettes in wild-type (A), control-injected (D), syndapin I (G) and cobl morphants (J). (B,E,H,K) FM 4-64FX vital dye labeling shows a lack of dye uptake in syndapin I (H) and cobl (K) morphants in comparison with wild-type (B) and control-injected larvae (E). (C,F,I,L) Merged images of the mostly apical FM-labeling of vesicular structures and claudin-GFP. Scale bar: 20 μm. EXPRESSION / LABELING:
|
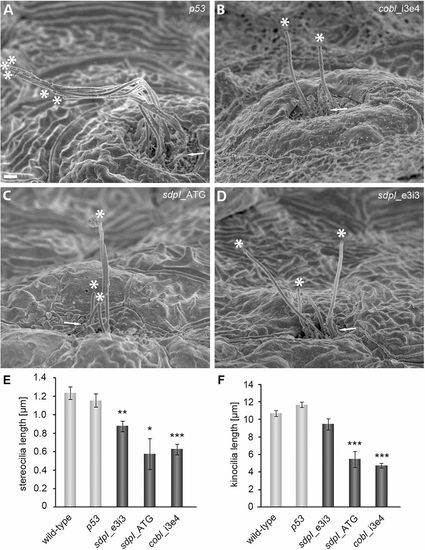
Both F-actin-rich stereocilia and microtubule-based kinocilia are defective in cobl and sdpI morphants. (A–D) SEM images of hair cells of neuromasts of zebrafish embryos injected as indicated at 72hpf. In both cobl- (B) and sdpI-morphant fish (C,D), kinocilia are reduced in number and significantly shortened. Tips of kinocilia are marked by asterisks. F-actin-rich stereocilia (arrows in A–D mark examples) also are severely affected. Scale bar: 1μm. (E,F) Quantitative analyses of observable stereocilia (E) and kinocilia (F). Wild-type, n = 99 kinocilia/82 stereocilia; control MO p53, n = 80 kinocilia/17 stereocilia; MO sdpI_e3i3, n = 37 kinocilia/38 stereocilia; MO sdpI_ATG, n = 10 kinocilia/5 stereocilia; MO cobl_i3e4, n = 58 kinocilia/19 stereocilia. Statistical analyses were performed versus wild-type. *P<0.05, **P<0.01, ***P<0.001. Kinocilia defects observed in cobl and syndapin I morphants (F) show even higher statistical significances versus MO p53-control (not depicted), MO sdpI_e3i3 (**), MO sdpI_ATG (***) and MO cobl_i3e4 (***). PHENOTYPE:
|
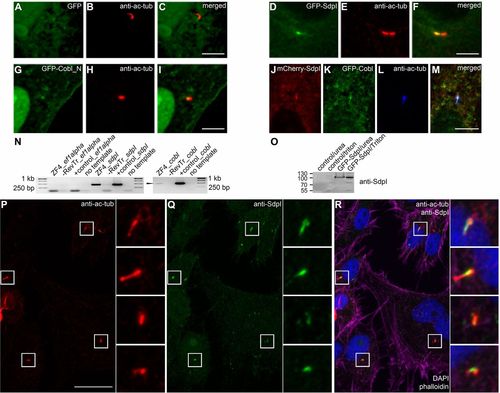
Syndapin I and Cobl localize to the base of forming cilia. (A–M) Localization of GFP (A), GFP-syndapin I (D) and GFP-Cobl_N (G), as well as of a combination of mCherry-syndapin I (J) and GFP-Cobl (K) in ZF4 cells in relation to cilia marked by anti-acetylated-tubulin antibodies (B,E,H,L). In merged images, co-localizations appear yellow in (C,F,I) and white in (M). Scale bars: 5µm. (N) RT-PCR analysis of ZF4 cell RNA for syndapin I and cobl. DNA plasmids were used as positive controls (+control) and ef1alpha served as a technical control. Both syndapin I and cobl (marked) were detected. (O) Affinity-purified anti-syndapin I antibodies specifically recognize zebrafish GFP-syndapin I overexpressed in HEK293 cells in immunoblotting analyses. (P–R) Acetylated tubulin (P) and endogenous syndapin I (Q) in ZF4 cells. The merged image (R) additionally includes phalloidin (purple) and DAPI (blue) labeling. Insets, magnifications of boxed areas. Scale bar: 20 μm. |
Syndapin I and Cobl localize to the base of forming cilia. (A–M) Localization of GFP (A), GFP-syndapin I (D) and GFP-Cobl_N (G), as well as of a combination of mCherry-syndapin I (J) and GFP-Cobl (K) in ZF4 cells in relation to cilia marked by anti-acetylated-tubulin antibodies (B,E,H,L). In merged images, co-localizations appear yellow in (C,F,I) and white in (M). Scale bars: 5μm. (N) RT-PCR analysis of ZF4 cell RNA for syndapin I and cobl. DNA plasmids were used as positive controls (+control) and ef1alpha served as a technical control. Both syndapin I and cobl (marked) were detected. (O) Affinity-purified anti-syndapin I antibodies specifically recognize zebrafish GFP-syndapin I overexpressed in HEK293 cells in immunoblotting analyses. (P–R) Acetylated tubulin (P) and endogenous syndapin I (Q) in ZF4 cells. The merged image (R) additionally includes phalloidin (purple) and DAPI (blue) labeling. Insets, magnifications of boxed areas. Scale bar: 20 μm. |
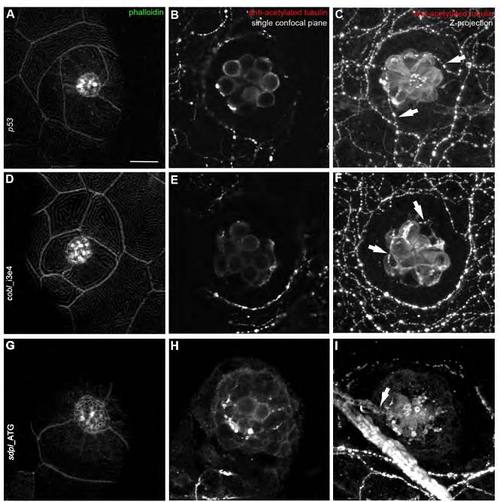
Morphology and innervations of mature neuromasts (5 dpf) are similar in controls and in cobl and syndapin I morphant larvae. (A,D,G) Phalloidin staining of mature neuromasts (5 dpf) visualizing the overall organization of neuromast rosettes of the posterior lateral line organ. Controls (A) as well as cobl (D) and syndapin I morphants (G) display properly polarized neuromasts. Single confocal planes illustrate the regular morphology of the cell clusters. (B,E,H,C,F,I) Immunolabeling with antiacetylated tubulin stains cell bodies, kinocilia and axons. Control, cobl- and syndapin I-morphant neuromasts are contacted by axons, as can be seen in the corresponding Z-projections of confocal images (C,F,I; marked by arrows). Bar, 10 μm. |