
- Title
-
Mef2cb regulates late myocardial cell addition from a second heart field-like population of progenitors in zebrafish
- Authors
- Lazic, S., and Scott, I.C.
- Source
- Full text @ Dev. Biol.

Photoconversion assay showed late myocardial addition to the arterial pole. (A). Schematic representation of myl7:nlsKikGR photoconversion assay. Hearts were exposed to UV light at 24 hpf (and later time points), permanently photoconverting nlsKikGR to a red fluorescent version and marking differentiated myocardial cells. At 48 hpf, myocardial cells marked by red fluorescence additionally expressed newly synthesized green fluorescing nlsKikGR (yellow in overlay), while new myocardial cells only expressed green fluorescing nlsKikGR. (B–B′′) Representative image of a heart photoconverted at 24 hpf and imaged at 48 hpf. White arrowhead indicates a population of green-only cells (B and B′′) that were not marked by red fluorescence (B′). (C) Cell counting of early and late ventricular myocardial nuclei. Hearts were exposed to progressively later UV exposures and imaged at 48 hpf. Number of green-only cells observed decreased with later UV exposure, whereas yellow cell numbers increased. Data is shown as mean ± SEM (D–D′′) Representative image of kdrl:nlsKikGR line, marking endothelial cells. UV photoconversion at 28 hpf and imaging at 48 hpf showed a population of green-only endothelial cells (compare D to D′, white arrow) at the arterial pole (D′′). Green channel (B and D), red channel (B′ and D′), and overlay (B′′ and D′′). Scale bar represents 50 μm. EXPRESSION / LABELING:
|
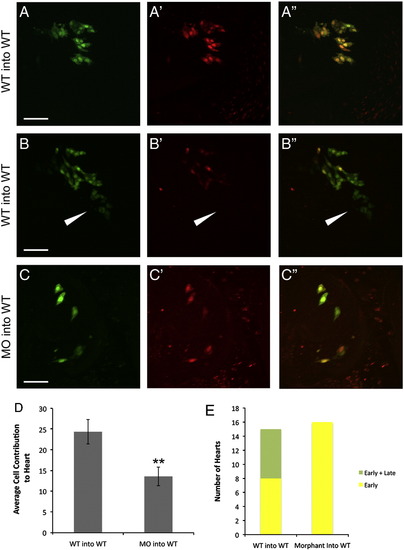
Contribution of wildtype and mef2cb morphant cells to early and late myocardial populations. WT cells transplanted to the WT host margin contributed to both early only (A–A′′) and late (arrowhead) and early (B–B′′) myocardial addition (quantified in E). Morphant cell (0.25 ng) transplanted to the WT host margin contributed only to early myocardial addition (C–C′′). The average number of heart cells found in the WT to WT or MO to WT transplants (D). Green channel (A–C), red channel (A′, B′, and C′), and overlay (A′′, B′′, and C′′). Data shown as mean ± SEM; **P < 0.01. Scale bar represents 50 μm. |
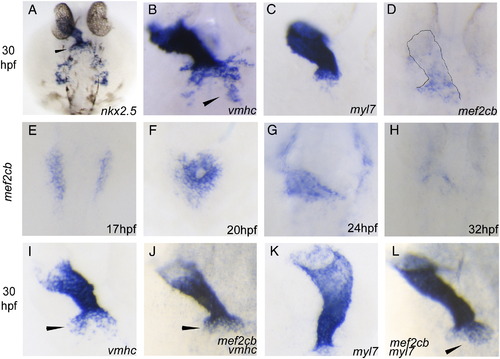
The late ventricular region was marked by known myocardial markers nkx2.5 and vmhc, as well as mef2cb. (A) nkx2.5 transcript was expressed in the heart tube, the late ventricular region (arrowhead), and bilateral pharyngeal domain. The late ventricular region was marked by vmhc (B), but not by myl7 (C). mef2cb was expressed in the presumed bilateral heart progenitors at 17 hpf (E), in the heart cone (F), and heart tube (G). Expression became gradually localized to the posterior ventricle (D) and became down-regulated by 32 hpf (H). mef2cb was co-expressed with vmhc (compare I to J). Probing for mef2cb and myl7 expression at the same time showed that mef2cb is expressed outside the heart tube at 30 hpf (compare K to L). EXPRESSION / LABELING:
|

mef2cb morphants displayed defects in early and late myocardial addition. Compared to WT controls (A), 48 hpf mef2cb morphant embryos displayed a heart edema and blood pooling (B). For (C–H) ntl probe was used as a midline reference. mef2cb expression was up-regulated in morphants at 17 hpf (compare C to D) and localization to the posterior ventricle was lost (compare C′′ to D′′). Morphant mef2cb expression at 17 hpf was expended posterior to ntl expression (D), whereas wildtype mef2cb expression is found anterior to ntl expression (C). myl7 expression (E vs. F) and vmhc expression (G vs. H) was reduced in morphants at all stages tested. At 17 hpf, morphant expression of myl7 (F) and vmhc (H) is significantly anterior to ntl expression, whereas wildtype expression of both genes (E and G) is found immediately anterior to ntl expression. At 30 hpf, morphant ventricles were smaller and lacked the late ventricular region (compare I to I′). The in situ data was corroborated by photoconversion assay, in which the morphant ventricle (J′) was smaller compared to controls (J). A decrease in both late and early myocardial addition was observed in mef2cb morphants (K). Data shown as mean ± SEM; **P < 0.01. Scale bar represents 50 μm. EXPRESSION / LABELING:
PHENOTYPE:
|
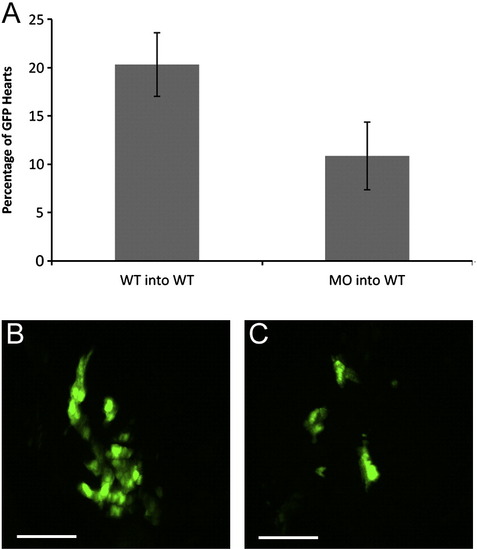
Cardiac contribution of mef2cb morphant cells. (A) Morphant transplants contributed to fewer hearts than wildtype transplants, but the difference was not significant (P = 0.12). Within an individual heart, morphant cells contributed fewer cells (C) when compared to wildtype controls (B). Data shown as mean ± SEM. Scale bar represents 100 μm. |

FGF signaling between 20 and 30 hpf was required for early and late myocardial addition. Chemical inhibition of FGF signaling between 20 and 30 hpf completely abolished mef2cb expression at 30 hpf (compare A to A′). At 30 hpf, the ventricle was smaller and the late ventricular region (arrowhead) was not seen in FGF inhibited embryos (compare B to B′). Photoconversion assay (D) between 30 and 48 hpf showed a smaller ventricle and less late myocardial addition in FGF inhibited embryos (C′) compared to DMSO treated control (C). Data shown as mean ± SEM; **P < 0.01. Scale bar represents 50 μm. |

Cell proliferation in the arterial pole. myl7:EGFP embryos were pulsed with BrdU for 1 h at 24 hpf (A) and 28 hpf (B) and cell proliferation was assessed at 48 hpf. The myocardium is visualized in the green channel and BrdU labeled cells are visualized in the red channel. Proliferating cells in the arterial pole of the heart (arrowheads) were quantified (C). Scale bar represents 70 μm. |
Photoconverted red fluorescing nlsKikGR persists for at least 48 hpf. (A–A′′) Fluorescent microscope images of embryo injected with 100 pg nlsKikGR mRNA at the one-cell stage. A small area of the tail was photoconverted at 24 hpf (A), with red fluorescence readily visible at 48 hpf (A′) and 72 hpf (A′′). (B and C) myl7:nlsKikGR transgenic embryos were photoconverted at 24 hpf and persistence of red fluorescence was ascertained at 48 hpf (B–B′′) and 72 hpf (C–C′′). Green channel (B and C), red channel (B′ and C′), and overlay (B′′ and C′′). Scale bar represents 50 μm. |

Late myocardial addition occurred rarely in the distal ventricle; newest myl7-positive cells were found distal to the arterial pole. (A–A′′) Single z-stack of 48 hpf heart exposed to UV at 30 hpf, with outline marking the ventricle. White arrowhead points to green fluorescing cells (A) that did not fluoresce red (A′). Overlay (A′′) showed these cells to be separate from green-only cell in arterial pole. (B–B′′) Over-exposure of 48 hpf heart exposed to UV at 30 hpf. White arrow points to faint green-only cells visible under high exposure (B), that did not fluoresce red (B′ and B′′ for overlay). Green channel (A and B), red channel (A′ and B′), and overlay (A′′ and B′′). Scale bar represents 50 μm. |
Late myocardial addition occurred during a short developmental period. Hearts exposed to UV at (A–A′′) 23 hpf and imaged at 28 hpf or (B–B′′) at 28 hpf and imaged at 32 hpf. White arrowheads indicate green-only fluorescing cells. Green channel (A and B), red channel (A′ and B′), and overlay (A′′ and B′′). Scale bar represents 50 μm. |
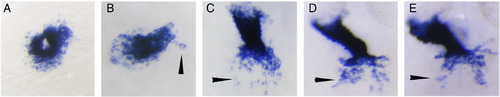
vmhc expression was found posterior to the heart tube in the late ventricular region. (A) vmhc expression in the heart cone at 20 hpf. (B) At 24 hpf, vmhc marked the elongating heart tube with putative expression outside the heart tube (arrowhead). Expression posterior to the heart (arrowhead) became progressively more pronounced from 26 hpf (C), 28 hpf (D) and 30 hpf (E). EXPRESSION / LABELING:
|
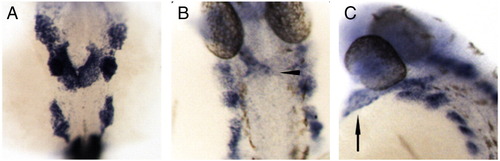
mef2ca marked the heart at 20 and 32 hpf. (A) mef2ca was expressed in the forming heart cone at 20 hpf. Expression is also seen in three bilateral dorsal domains and in the trunk somites. (B and C) At 32 hpf, mef2ca expression was seen throughout the heart tube, with potential late ventricular staining at the arterial pole (arrowhead). Dorsal bilateral and trunk somite staining was maintained. Dorsal view (B) shows ventricular expression of mef2ca, with the lateral view (C) showing expression in the atrium (arrow) as well. EXPRESSION / LABELING:
|

mef2cb morphants showed heart defects that are partially rescued by injection of morpholino-resistant mRNA. (A) 48 hpf heart phenotypes of WT control, mef2cb MO, and MO + mef2cb RNA rescue embryos. WT control embryos showed normal chamber inflation and alignment in 100% of cases (n = 16). Injection of 0.5 ng of mef2cb morpholino resulted in equal proportion of embryos showing strung out hearts (n = 14) and dysmorphic/unlooped hearts (n = 15). Co-injection of morphant embryos with 20 pg of mef2cb morpholino-resistant mRNA resulted in an increase in the milder dysmorphic/unlooped heart phenotype (n = 34) compared to strung out hearts (n = 11). (B–D) Representative images of 48 hpf hearts: (B) WT heart with inflated and aligned atrium and ventricle, (C) strung out heart with no chamber inflation, (D) dysmorphic/unlooped heart with inflated atrium and collapsed ventricle. (E and F) amhc staining in 26 hpf WT control (E) and mef2cb morphant (F). |

The bulbus arteriosus formed, but was reduced in size, in mef2cb morphants. (A) At 5 dpf, bulbus arteriosus (stained by DAF-2DA, green fluorescence) extended from the arterial pole of the ventricle (photoconverted nlsKikGR, red fluorescence). (B) The bulbus arteriosus developed and neighbored the arterial pole in mef2cb morphants, but was reduced in size and did not extend. Scale bar represents 50 μm. PHENOTYPE:
|

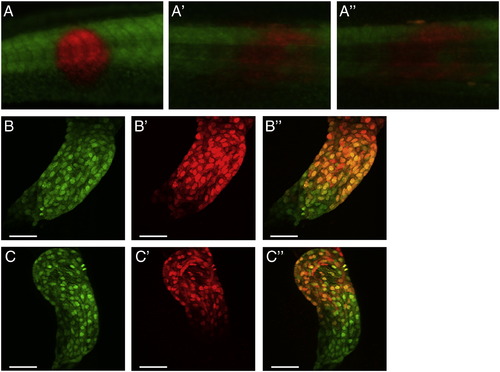
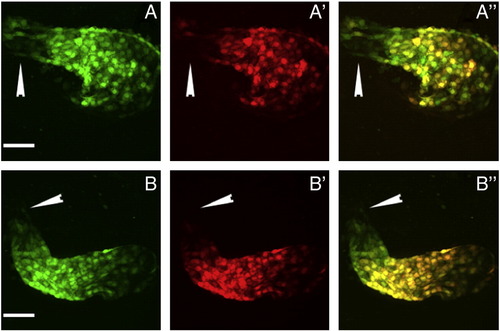
mef2cb did not affect endothelial addition to the arterial pole. Tg(flk1:nlsKikGR) embryos were exposed to UV light at 28 hpf and imaged at 48 hpf to ascertain if endothelial addition at the arterial pole is regulated by mef2cb. Control embryos showed green-only endothelial cells (A, white arrowhead) posterior to the atrial pole that lack red fluorescence (A′). The overlay (A′′) showed endocardial cells to fluoresce green and red. Green-only endothelial cells (compare B to B′) were still present in the mef2cb morphant. Even though there are fewer endocardial cells, reflecting the smaller morphant ventricle, all endocardial cells were green and red (B′′). Green channel (A and B), red channel (A′ and B′), overlay (A′′ and B′′). Scale bar represents 50 μm. |
Reprinted from Developmental Biology, 354(1), Lazic, S., and Scott, I.C., Mef2cb regulates late myocardial cell addition from a second heart field-like population of progenitors in zebrafish, 123-133, Copyright (2011) with permission from Elsevier. Full text @ Dev. Biol.