
- Title
-
Non-core subunit eIF3h of translation initiation factor eIF3 regulates zebrafish embryonic development
- Authors
- Choudhuri, A., Evans, T., and Maitra, U.
- Source
- Full text @ Dev. Dyn.

Both zebrafish genes are expressed, with eif3ha transcript levels being predominant during early embryogenesis. A: Semiquantitative reverse transcriptase-polymerase chain reaction (RT-PCR) analysis of total RNA isolated from 24 hours postfertilization (hpf) embryos using two different pairs of primers that are specific for each ortholog. RT-PCR was performed using 0.25, 0.5, or 1.0 μg of total RNA as substrate. B-E: Semiquantitative RT-PCR using a single set of forward and reverse primers that amplify both eif3ha and eif3hb mRNAs followed by diagnostic digestion with either StuI (S) cleaving eif3ha cDNA or KpnI (K) cleaving eif3hb cDNA. B: Samples were derived from embryos at different developmental stages as indicated; zygote (maternal, mat), 3 hpf, 50% epiboly (50%), 20 somite (20S), 24 hpf, 2, 3, or 4 days postfertilization (dpf). D: Samples from different adult organs: intestine (Int), Swim-bladder (SB), kidney (Kid), heart (Hrt), eye, or brain (Brn). C,E: The graphical quantification of the gel electrophoresis results shown in B and D, respectively. It should be noted that experiments in panels B and D and the corresponding quantification in panels C and E are representative of several independent experiments. |

During early embryogenesis, the two eif3h genes are expressed ubiquitously while by 24 hours postfertilization (hpf) the genes are expressed in distinct and restricted patterns. Panel a: Early embryogenesis (<24 hpf). Panels A-F show representative in situ hybridization patterns for eif3ha while panels G-L are those for eif3hb. For eif3ha, panels A, C, and E represent the lateral view while B, D, and F show the dorsal view. For eif3hb, panels G, K, and I represent the lateral view while H, J, and L show the dorsal view. Panels M-O show the control embryos treated with an eif3ha sense probe. For each of the above panels, the hybridization patterns were determined at 3 hpf, 8 hpf or 10 somites, as indicated. Panel b: In situ hybridization patterns for later stages of embryogenesis (≥24 hpf). Panels A-J for eif3ha: A-E show lateral views and F-J show dorsal views; panels K-T for eif3hb: K-O represent lateral views and P-T represent dorsal views). Panels U-Y show control embryos hybridized with an eif3ha sense probe. The specific developmental stages examined are indicated. The red arrows in panels A, B, F, and G highlight the specific expression pattern of eif3ha in the developing somites while the green arrows in panels K, L, and P indicate distinct expression of eif3hb in the cardiac-associated regions. Blue open arrowheads in C and D indicate expression of eif3ha at the midbrain-hindbrain boundary. Blue block arrowheads and blue block arrows show eif3ha expression in otic capsules and fin-buds, respectively, while the blue stars indicate transcripts in the gut tube and liver. Green stars in panels N and S mark the condensed expression of eif3hb at 3 dpf in the brain. At 4 dpf, eif3ha and eif3hb transcripts are present in specific areas of the alimentary canal: eif3ha transcripts in the intestinal bulb (E and J, blue open arrows) and esophagus (E, red open arrowhead) while eif3hb in the esophagus with a relatively weak signal (O, green open arrowhead). |
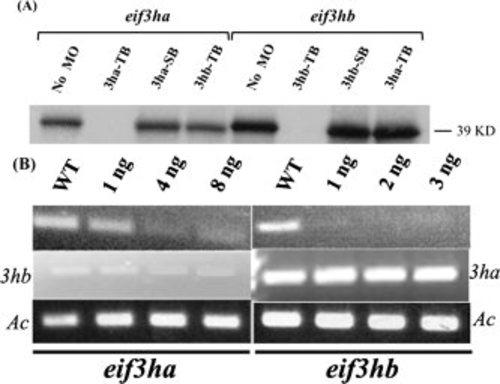
The morpholinos targeting the eif3ha or eif3hb transcripts demonstrate specificity. A: In vitro transcription-translation assays were performed in the presence of specific morpholinos as follows: translational blocking morpholino for eif3ha and eif3hb are represented as 3ha-TB and 3hb-TB, respectively, while the splice blocking morpholino for each transcript is represented as 3ha-SB or 3hb-SB, respectively. The nonspecific morpholinos (TB morpholino for the other eif3h gene) were also used as indicated. A control reaction without any morpholino (No MO) was also included. The specific DNA constructs used were as indicated. B: Semiquantitative reverse transcriptase-polymerse chain reaction (RT-PCR) assays were carried out using total RNA isolated from splice morphants for eif3ha or eif3hb, as shown. In each case, RT-PCR results for the other eif3h gene was also included to exclude the possibility of cross-targeting by the morpholinos. It should be noted that compared with eif3ha, a very low level of eif3hb transcripts is observed at 24 hours postfertilization (hpf), in accordance with the in situ hybridization data and RT-PCR analyses shown in Fig. 3 and Fig. 2, respectively. Embryos were injected with the indicated amounts of SB MOs specific for either eif3ha or eif3hb. A wild-type control (WT) was also included. β-actin (Ac) was used as an internal control. |
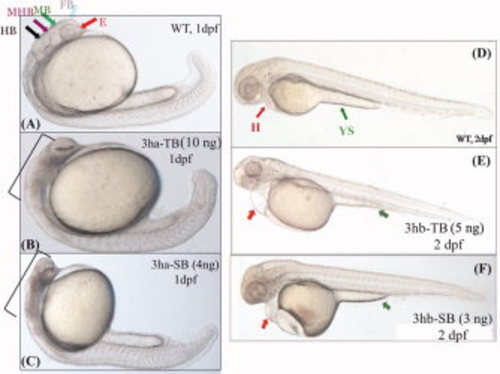
Each of the eif3h morphants show distinct embryonic phenotypes. B,C,E,F: Shown are representative morphant phenotypes obtained by injecting either TB or SB morpholino (MO) for eif3ha (3ha-TB or 3ha-SB) at 1 dpf (B,C) and for eif3hb (3hb-TB or 3hb-SB) at 2 dpf (E,F). A,D: In each case, an uninjected wild-type (WT) control is also included. In panel A, different regions of the normal brain in a WT embryo at 24 hpf are shown: eye (E), forebrain (FB), midbrain (MB), midbrain-hindbrain boundary (MHB), and hindbrain (HB) as indicated by different colored arrows. For the eif3ha morphants (~100%, n ~ 200), after injection of either TB MO (B) or SB MO (C), gross disruption of all the brain regions are shown using brackets. For the eif3hb morphants (90-95%, n ~ 200) at 2 dpf obtained with either TB MO (E) or SB MO (F), specific defects in the form of edema seen around the heart region (H) and regression of yolk stalk (YS) are indicated with the red and green arrows, respectively. |
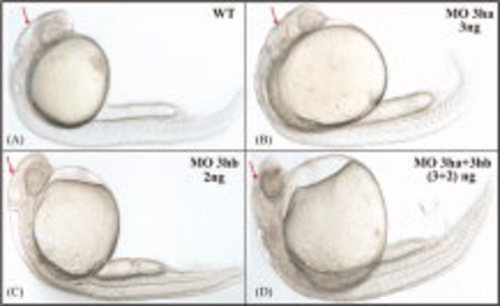
The two eIF3h orthologs have at least some functional redundancy. Shown are representative embryos, obtained by injecting at the one-cell stage specific SB morpolinos for eif3ha or eif3hb, either separately or in combination, as indicated. A: Uninjected wild-type (WT) control. B: 3 ng of eif3ha MO (MO 3ha). C: The 2 ng eif3hb MO (MO 3hb). D: The 3 ng MO 3ha + 2 ng MO 3hb together (~100%, n > 50-80). Arrows highlight the relative development of the brain region. PHENOTYPE:
|

The distinct expression pattern of eif3ha in developing somites overlaps with the well-characterized marker myod. A,B: The expression for myod and eif3ha transcripts, respectively. C: The double in situ hybridization using both the probes together. A representative embryo is shown indicating the expression of digoxigenin-labeled eif3ha probe only in the anterior portion, fluorescein-labeled myod probe only in the tail tip and expression of both the transcripts overlapping in the body trunk region. The magenta block arrows indicate expression of both the transcripts at somite centers. D: A closer view of the trunk region including the tail. The regions of expression of only myod or eif3ha are shown using the orange and magenta arrows, respectively. The individual somites are represented using parentheses. Within a somite, the magenta arrow shows the expression of both the mRNAs in the posterior region, while the violet arrow indicates the specific expression of eif3ha mRNA alone in the anterior segment. |
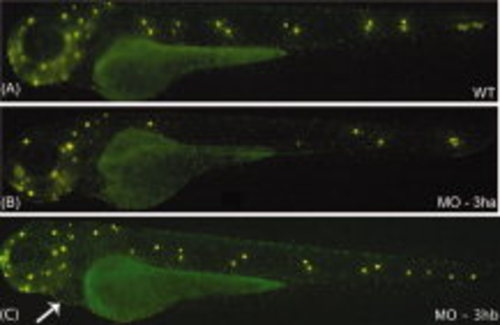
Development of trunk neuromast sensory organs fails in the eif3ha morphants. Shown are representative embryos after staining with Di-Asp at 3 dpf to identify neuormasts. A: The representative embryo demonstrates the normal distribution of neuromasts (bright yellow spots) in an uninjected wild-type (WT) embryo. B,C: This is compared with one of the representative embryos injected with either 3 ng of eif3ha SB morpholino (MO-3ha) as shown in B or 2-4 ng of eif3hb TB morpholino (MO-3hb) as shown in C. Note that at this dose, the severe brain defect did not occur using MO-3ha, although most of the trunk neuromasts are absent in the eif3ha morphants (90-95%, n ~ 100). In contrast, for the eif3hb morphants, neuromast formation appears normal even though the cardiac phenotype for this morphant begins to appear (indicated by the white arrow). PHENOTYPE:
|
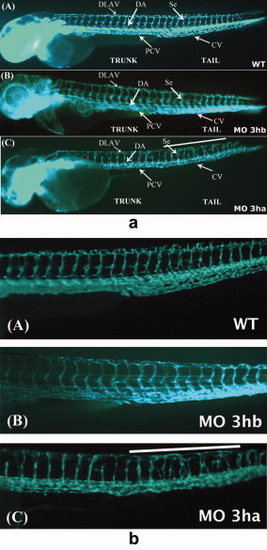
eif3ha morphants also display defects in segmental vessel formation. Panel a: Shown are representative embryos at 3 days postfertilization (dpf) derived from transgenic fli:gfp parents, allowing visualization of the developing vasculature. Panels A and B show the uninjected wild-type (WT) and eif3hb morphant (MO) embryos (6ng/injection), respectively, with normal vasculature pattern, while panel C represents eif3ha morphant embryos with clear defects in segmental vessel formation (70-75%, n ~ 100). Note that the eif3hb morphants received a relatively low dose of morpholino with no apparent brain degeneration phenotype. The caudal vein (CV), posterior cardinal vein (PCV), dorsal aorta (DA), dorsal longitudinal anastomotic vessel (DLAV) are indicated. Panel b: Shown are higher magnification views of the mid-trunk region where irregular segmental vessel formation (Se) is most severe in the eif3ha morphants (panels C) compared with uninjected and eif3hb morpholino injected embryos (panels A and B, respectively). This region in the eif3ha morphants is indicated with a white line in both panel a and panel b. PHENOTYPE:
|
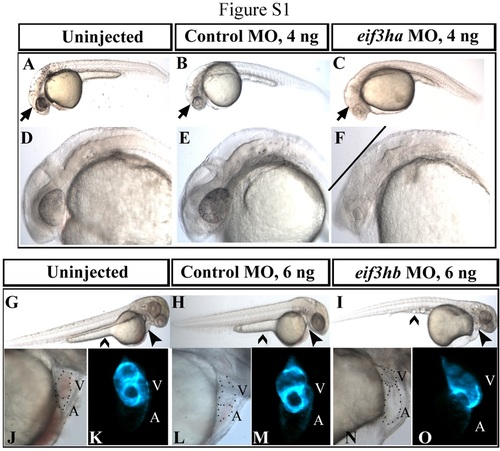
Zebrafish eif3h morphants show specific phenotypes compared with uninjected and control morpholino-injected embryos. Shown are representative morphant phenotypes obtained by injecting specific morpholinos (MO) for eif3ha observed at 1 dpf (C and F) and for eif3hb observed at 2 dpf (I, N, and O). In each case, uninjected embryos (panels A and D for eif3ha and panels G, J and K for eif3hb) are compared with control morpholino-injected embryos (panels B and E for eif3ha and panels H, L, and M for eif3hb) using the same amount of morpholino that give rise to the specific phenotypes for either eif3ha or eif3hb morpholino. Arrows in panels A-C show normal brain development in uninjected and control morpholino-injected embryos (Panels A and B, respectively), while the brain degeneration phenotype was obtained by loss of eif3ha (panel C). A closer view of the eif3ha morphant in the brain region is included in Panel F compared with panels D and E. All of the major brain regions including eyes are severely deformed in these embryos (indicated by the straight line in panel F). The phenotypic manifestation due to loss of eif3hb in the form of edema around the heart and the regression of yolk stalk (closed and open arrowheads respectively) are compared in panel I with respect to panels G and H. Higher magnification views of the pericardial edema and the defective cardiac morphogenesis in the eif3hb morphants are depicted in panel N (compared with panels J and L). In comparison with the uninjected and control morpholino-injected embryos, in these morphants the cardiac tube is not looped properly resulting in extension of the distance between the atrium (A) and the ventricle (V) (cardiac periphery is represented by the dotted lines). The defects in cardiac morphogenesis obtained by injecting eif3hb morpholino was also documented in cmlc2:gfp transgenic embryos, which express GFP specifically in the developing heart, shown in panel O compared with panels K and M. PHENOTYPE:
|
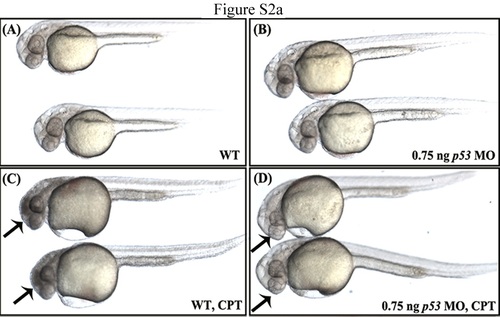
The brain degeneration phenotype obtained for eif3ha morphants is likely not due to off-target effects mediated by up-regulation of p53. Panel a. Panels A and B represent wild-type uninjected embryos and embryos injected with 0.75 ng of p53-specific morpholino, respectively. Under these conditions, there is no apparent morphant phenotype. In panel C, wild-type 24 hours postfertilization (hpf) embryos were treated with 500 nM camptothecin (CPT) and cultured for 3-4 hr. This drug is known to induce p53-mediated apoptosis in zebrafish (Suppl. Ref: Langheinrich et al., 2002). The apoptosis induced by CPT is clearly visible in these embryos as dark tissue especially in the brain region (arrows). Panel D represents the p53-morphant embryos, which remained in CPT for 3-4 hr. In contrast to the wild-type embryos, CPT-mediated apoptosis was not observed (~95-100%, n > 30-40). This result shows that injection of 0.75 ng of this p53-specific morpholino is sufficient to rescue CPT-mediated apoptosis induced by up-regulation of p53. |

Panel b: Panel B shows a representative embryo with brain degeneration phenotype as a result of injecting 4 ng of morpholino (arrowhead). Co-injection of 0.75 ng of the same p53-specific morpholino described above did not rescue this phenotype (compare panel C with panel A). These results suggest that the brain phenotype obtained by loss of eif3ha is not due to p53-induced off target effects. |
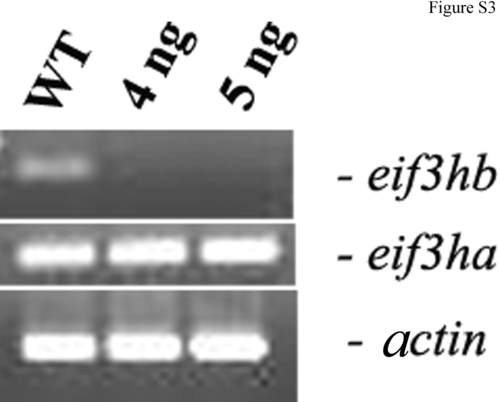
The splice-blocker morpholino targeting eif3hb pre-mRNA retains specificity at high dosage. Reverse transcriptase-polymerse chain reaction (RT-PCR) assays were carried out using total RNA isolated from eif3hb morphant embryos targeted with 4 or 5 ng of splice-blocker morpholino to measure the relative levels of both eif3ha and eif3hb mature mRNAs. Under these conditions, eif3hb morphants showed severe brain degeneration phenotypes. A wild-type control (WT) was also included. β-actin (actin) was used as an internal control. |
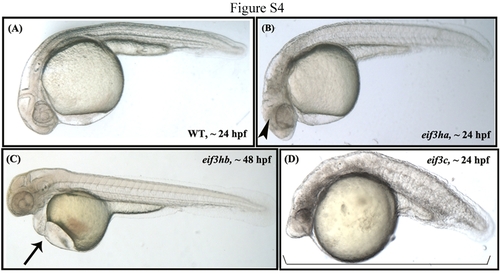
The loss of function phenotype for a core eIF3 subunit, eif3c, is distinct from that obtained for loss of either eif3ha or eif3hb, affecting the overall features of early embryogenesis. A,B: Compared with 24 hours postfertilization (hpf) control uninjected embryos in panel A, eif3ha morphants at the same stage lack properly formed brain structures (indicated by an arrowhead in panel B), whereas, stage-matched eif3c embryos are severely damaged with an overall grossly defective development. C: Likewise, loss of eif3hb results in a distinct cardiac edema phenotype (represented by an arrow in panel C) at ~2 days postfertilization (dpf) - a time point when most eif3c morphant embryos fail to survive. Supplementary reference: Langheinrich U, Hennen E, Stott G, Vacun G. 2002. Zebrafish as a model organism for the identification and characterization of drugs and genes affecting p53 signaling. PHENOTYPE:
|

Unillustrated author statements |