
|
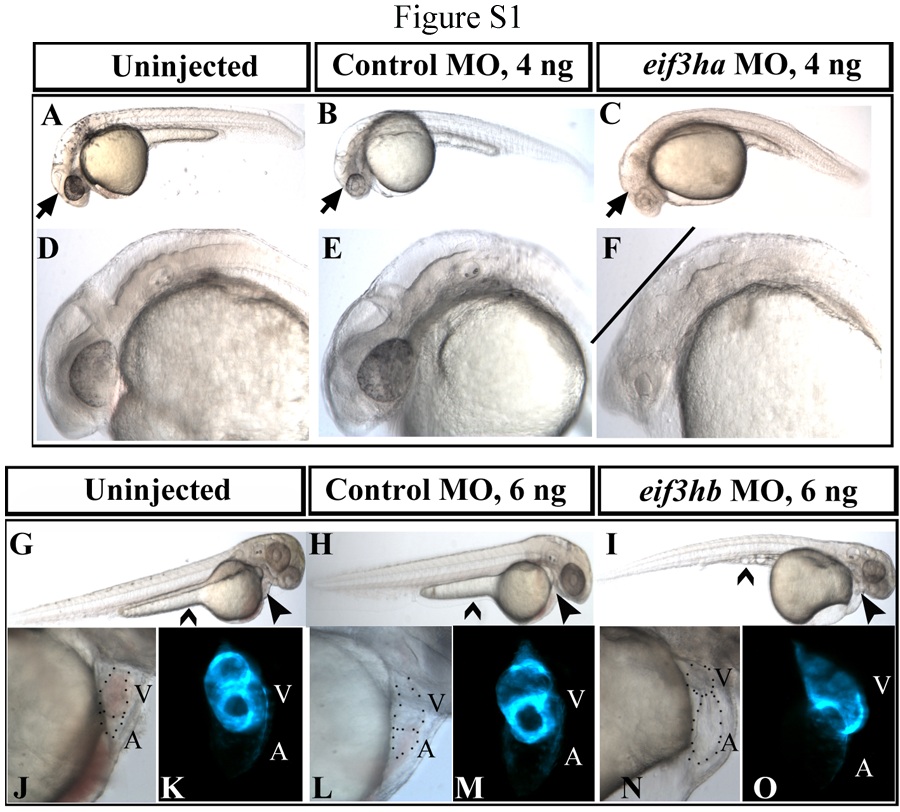
Fig. S1 Zebrafish eif3h morphants show specific phenotypes compared with uninjected and control morpholino-injected embryos. Shown are representative morphant phenotypes obtained by injecting specific morpholinos (MO) for eif3ha observed at 1 dpf (C and F) and for eif3hb observed at 2 dpf (I, N, and O). In each case, uninjected embryos (panels A and D for eif3ha and panels G, J and K for eif3hb) are compared with control morpholino-injected embryos (panels B and E for eif3ha and panels H, L, and M for eif3hb) using the same amount of morpholino that give rise to the specific phenotypes for either eif3ha or eif3hb morpholino. Arrows in panels A-C show normal brain development in uninjected and control morpholino-injected embryos (Panels A and B, respectively), while the brain degeneration phenotype was obtained by loss of eif3ha (panel C). A closer view of the eif3ha morphant in the brain region is included in Panel F compared with panels D and E. All of the major brain regions including eyes are severely deformed in these embryos (indicated by the straight line in panel F). The phenotypic manifestation due to loss of eif3hb in the form of edema around the heart and the regression of yolk stalk (closed and open arrowheads respectively) are compared in panel I with respect to panels G and H. Higher magnification views of the pericardial edema and the defective cardiac morphogenesis in the eif3hb morphants are depicted in panel N (compared with panels J and L). In comparison with the uninjected and control morpholino-injected embryos, in these morphants the cardiac tube is not looped properly resulting in extension of the distance between the atrium (A) and the ventricle (V) (cardiac periphery is represented by the dotted lines). The defects in cardiac morphogenesis obtained by injecting eif3hb morpholino was also documented in cmlc2:gfp transgenic embryos, which express GFP specifically in the developing heart, shown in panel O compared with panels K and M.