
|
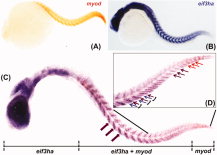
Fig. 7 The distinct expression pattern of eif3ha in developing somites overlaps with the well-characterized marker myod. A,B: The expression for myod and eif3ha transcripts, respectively. C: The double in situ hybridization using both the probes together. A representative embryo is shown indicating the expression of digoxigenin-labeled eif3ha probe only in the anterior portion, fluorescein-labeled myod probe only in the tail tip and expression of both the transcripts overlapping in the body trunk region. The magenta block arrows indicate expression of both the transcripts at somite centers. D: A closer view of the trunk region including the tail. The regions of expression of only myod or eif3ha are shown using the orange and magenta arrows, respectively. The individual somites are represented using parentheses. Within a somite, the magenta arrow shows the expression of both the mRNAs in the posterior region, while the violet arrow indicates the specific expression of eif3ha mRNA alone in the anterior segment.