
- Title
-
Muscle development is disrupted in zebrafish embryos deficient for fibronectin
- Authors
- Snow, C.J., Peterson, M.T., Khalil, A., and Henry, C.A.
- Source
- Full text @ Dev. Dyn.
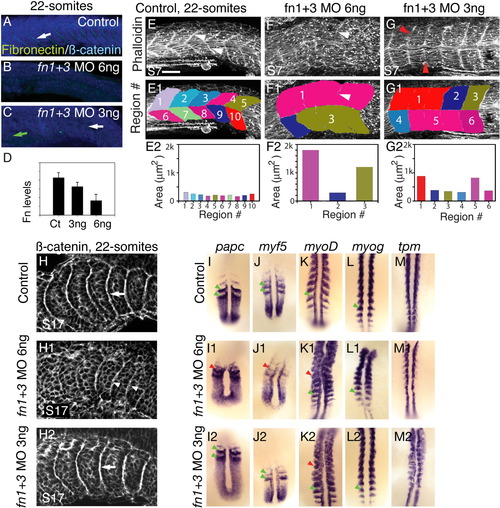
A reduction in fibronectin (Fn) levels disrupts formation of anterior somites. A-D: Side views, anterior left, dorsal top, of 22-somite embryos stained for Fn (green) and β-catenin (blue) to visualize all cells. Somite 10, or the approximate region of somite 10, is to the left. A: In control embryos, Fn is concentrated at segment boundaries (white arrow). B: Injection of 6-ng fn1+3 morpholinos (MOs) results in a strong reduction Fn protein. C: In embryos injected with 3-ng fn1+3 MOs, Fn is reduced anteriorly (green arrow). Posteriorly, Fn concentration at boundaries is stronger, but not as strong as control posterior boundaries (white arrow). D: Quantification of levels of Fn in 3-ng and 6-ng morphants (y axis is arbitrary units). Fn protein is reduced in 3-ng fn1+3 morphants and strongly reduced in 6-ng fn1+3 morphants. E-G: Side views, anterior left, dorsal top, of 22-somite embryos stained with phalloidin to outline cells. E: Somite 7, or the approximate region of somite 7 is to the left. In control embryos, segment boundaries are clearly visible (white arrowheads). Segment boundaries were interactively traced (E1, see the Experimental Procudures section). The myotomes in control embryos are approximately the same size (E2). F: In 6-ng fn1+3 MO-injected embryos, anterior myotome boundary formation is severely disrupted (F, F1, white arrowheads indicate a tiny myotome boundary in the original data and the same image with myotome regions overlaid) and myotomes areas are large and irregular. G: Anterior myotomes are less disrupted in 3-ng fn1+3 MO-injected embryos (red arrowheads indicate where boundaries should be). H: Side views, anterior left, dorsal top, of 22-somite embryos stained with β-catenin, somite 17 or the approximate region thereof is on the left. In control embryos somite boundaries are seen as bright white lines (H, white arrow). In embryos injected with 6 ng of fn1+3 MOs imperfect posterior somite boundaries form (H1, white arrowheads). Robust somite boundaries form in the posterior of 3-ng fn1+3 morphant embryos (H2, white arrow). I-M: Dorsal views, anterior top, of 18-somite embryos. Analysis of mRNA expression correlates with the morphological analysis in that injection of 3-ng fn1+3 MOs disrupts anterior, but not posterior, patterning. Note that gene expression patterns in the posterior presomitic mesoderm such as papc and myf5 is segmental in both control and 3-ng fn1+3 MO-injected embryos (I, I2, J, J2, green arrowheads) but the segmental pattern is slightly disrupted in 6-ng fn1+3 MO-injected embryos (I1,J1, red arrowheads). myoD is expressed in stripes in control (K, green arrowhead) embryos throughout the A-P axis. Striped expression of myoD is disrupted in the anterior of 3 and 6-ng fn1+3 MO-injected embryos (K1, K2, red arrowheads) but is segmental posteriorly (K1, K2, green arrowheads). The expression patterns of myogenin (myog) and tropomyosin (tpm) are similar, but levels of myog and tpm in the posterior of 6-ng fn1+3 morphants are qualitatively reduced. Scale bar = 50 μm. EXPRESSION / LABELING:
PHENOTYPE:
|

Uncoupling of fast- and slow-twitch muscle morphogenesis in fn morphants. A: Cartoon showing the qualitative definition of the posterior limit of defects (PLD) that was used in this study. The PLD was considered to be the anterior most somite at which segmentally reiterated somite boundaries (albeit disrupted) were observed. B: Graph depicting posterior limit of boundary defects of embryos injected with 3- or 6-ng fn1+3 MOs. Morphant myotome defects are examined at three time points: 24 (n = 11 embryos), 32 (n = 20 embryos), and 48 (n = 13 embryos) hours postfertilization (hpf). Average PLD ± standard deviation is shown. C: Cartoon depicting the region of analysis in the embryo. Because posterior somites form in 3-ng fn1+3 morphant embryos, subsequent muscle morphogenesis was analyzed only in the posterior region (> somite 8) of 32 and 48 hpf embryos. D-I: Side views, anterior left, dorsal top, of embryos stained with F59 (green) to visualize heavy chain myosin (slow-twitch muscle) and phalloidin (red) denoting filamentous actin (fast-twitch muscle). D,G: In control embryos, MTJ boundaries are observed in slow-twitch and fast-twitch muscle (D, G, yellow arrowheads). When the two domains are overlaid, it is clear that the fast-twitch domain mirrors the slow-twitch domain (D5, D6). At 48 hpf, control embryos exhibit similar muscle morphology, with clear slow- and fast-twitch myotome boundaries and the two domains line up (G5, G6). E,H: Uncoupling of MTJ boundaries in the fast-and slow-twitch muscle domains in 3-ng fn1+3 morphant embryos. Although there are gaps in the slow-twitch domain (E1, H1, yellow asterisks), MTJ boundaries are readily apparent (yellow arrowheads). Fast-twitch fibers often cross the myotome boundary denoted by slow fibers (E4, H4, white arrowheads). This uncoupling of fast-twitch and slow-twitch morphogenesis is readily apparent when the images are overlaid (E6, H6, white arrowheads). F,I: Embryos injected with 6-ng fn1+3 MOs display more severe disruptions of MTJ boundaries, fiber morphology, and uncoupling of MTJ boundaries in the fast-twitch and slow-twitch muscle domains. J: Graph showing fast-twitch fiber and slow-twitch segment perimeters through time. In control embryos, fast-twitch and slow-twitch segment domains are approximately the same size (n = 165 myotomes). In contrast, fast and slow-twitch segment domains in fn1+3 morphant embryo are more variable (n = 126 3-ng fn morphant myotomes and n = 152 6-ng fn morphant myotomes). The trend toward a larger fast-twitch domain in fn1+3 morphant embryos reflects the uncoupling of fast-twitch and slow-twitch muscle morphogenesis. K: Graph depicting ratio of fast-twitch to slow-twitch muscle domain segment perimeter through time. The ratio was obtained by dividing the average fast-twitch myotome perimeter by the average slow-twitch myotome perimeter. There is approximately a 1:1 ratio of fast to slow muscle segment perimeters in control embryos. This ratio is increased in fn1+3 morphant embryos, indicating that fast-twitch muscle domains are larger than the corresponding slow-twitch muscle domains. |

Muscle morphogenesis in fn morphant embryos is more disrupted than in aei/deltaD mutant embryos. A: Summary of experimental design. Muscle development in the posterior of aei/deltaD mutant embryos, where initial somite boundaries did not form, was compared with muscle development in the posterior of 3-ng fn1+3 morphant embryos, where initial somite boundaries did form. Three phenotypes were assessed: uncoupling of fast and slow fiber lengths, absolute fast and slow fiber lengths, and anisotropy (a quantitative measure of organization, see Fig. 4). B-G: Fast-twitch and slow-twitch fiber lengths are more frequently uncoupled in fn morphant embryos than in aei/deltaD mutant embryos. Side views, anterior left, F59 (green) denotes slow-twitch muscle and phalloidin (red) denotes fast-twitch muscle. B,C: Fast-twitch and slow-twitch fibers are approximately the same length at 69% of boundaries in fn1+3 morphant embryos, and at 92% of boundaries in aei/deltaD morphant embryos. D,E: When slow-twitch fibers exhibit disruptions such as gaps, fast-twitch fibers are longer than slow-twitch fibers. F,G: Fast-twitch fibers are sometimes longer than slow-twitch fibers when slow-twitch fibers either appear normal or show only minor disruptions. H: Fast-twitch fibers are longer in fn1+3 morphant embryos than in aei/deltaD mutant embryos. H1-H2: Fibers were interactively traced in Axiovision and the major axes calculated. Note that some fibers are unusually long (white arrowhead). H3,H4: Average fast-twitch and slow-twitch fiber lengths are significantly longer in fn morphant embryos than in either control or aei/deltaD mutant embryos (P < 0.01). H5: The ratio of fast-twitch to slow-twitch fiber lengths is higher in fn1+3 morphant embryos. This increase is indicative of the more frequent uncoupling of fast-twitch and slow-twitch fiber lengths in fn morphant embryos. |
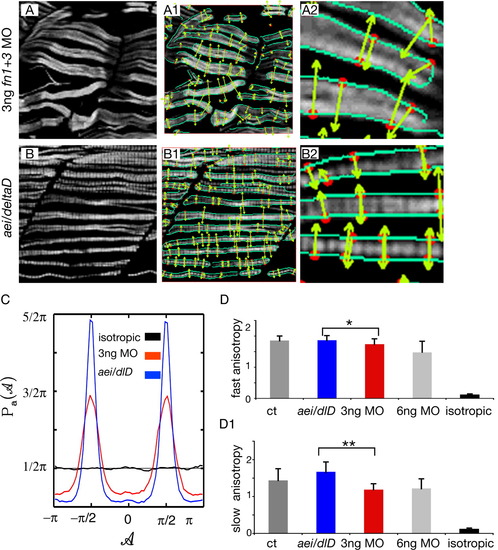
Muscle fibers in 3-ng fn1+3 morphant embryos are more randomly structured than fibers in aei/deltaD mutant embryos. A,B: F59 denotes slow-twitch fibers, side views, anterior left, dorsal top. Note that fibers in 3-ng fn1+3 morphant embryos appear slightly more disorganized than those in aei/deltaD mutant embryos. The maxima chains (A1, A2, B1, B2, green edge detection lines) are defined by the positions where the Wavelet-Transform Modulus is locally Maximum (i.e., the WTMM) in the direction A of the gradient vector. The WTMM maxima (WTMMM; A1, A2, B1, B2, red dots) indicate locally the direction where the signal has the sharpest variation (A1, A2, B1, B2, green arrows). C: The WTMMM vector angle probability density functions (pdfs) are displayed for the aei/deltaD mutants (blue curve), the fn1+3 morphants (red curve), as well as for the isotropic fBm surfaces analyzed for calibration purposes (black curve fluctuating around π/2). Also shown is the flat 1/2π curve that would be obtained for a purely theoretical isotropic process (flat pointed line at 1/2π). Note the stronger peaks in aei/deltaD mutant embryos. D-D1: The anisotropy factor, an indication of organized structure, of fast-twitch fibers in fn morphant embryos is not only significantly lower than in control embryos, but is also significantly lower than in aei/deltaD mutant embryos. In contrast, the anisotropy factor of fast-twitch fibers in aei/deltaD mutant embryos is not significantly different from control embryos. These results indicate that fast-twitch fibers in fn morphant embryos not only appear more disorganized, but are quantitatively more disorganized than in aei/deltaD mutant embryos. The anisotropy of slow-twitch fibers in fn morphant embryos is also significantly lower than in control embryos and aei/deltaD mutant embryos. *P < 0.05, **P < 0.001. For comparison, the anisotropy factor obtained from the analysis of the isotropic fBm images (0.12 ± 0.02) is also shown. |