
- Title
-
Sulf2a controls Shh-dependent neural fate specification in the developing spinal cord
- Authors
- Danesin, C., Darche-Gabinaud, R., Escalas, N., Bouguetoch, V., Cochard, P., Al Oustah, A., Ohayon, D., Glise, B., Soula, C.
- Source
- Full text @ Sci. Rep.
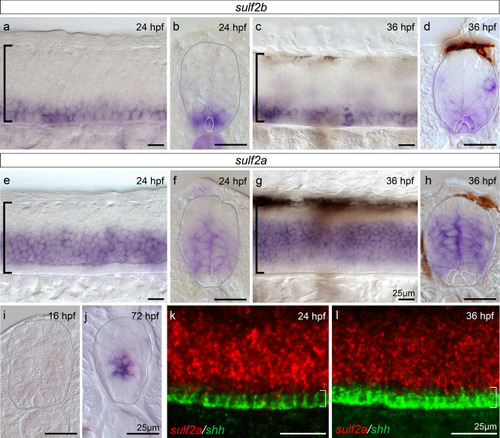
EXPRESSION / LABELING:
|
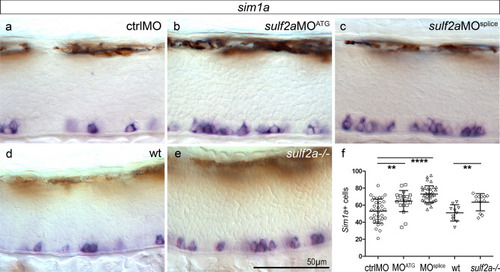
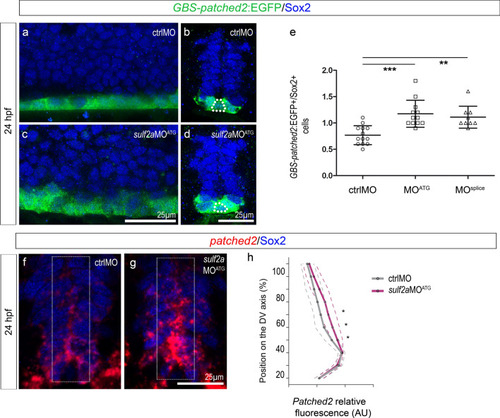
V3 interneuron production is increased upon |

Sulf2a depletion impairs OPC development. Side views of 48 hpf embryos. ( PHENOTYPE:
|
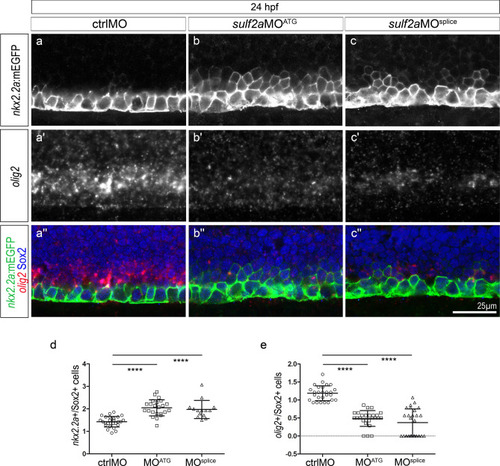
The Nkx2.2a/p3 domain is dorsally expanded at the expense of the Olig2/pMN domain in 24 hpf |
|

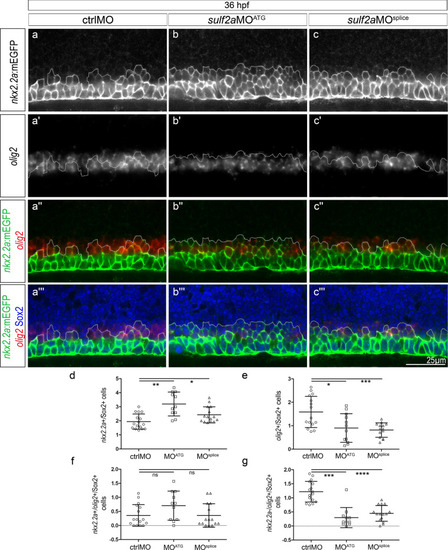
PHENOTYPE:
|

|
PHENOTYPE:
|
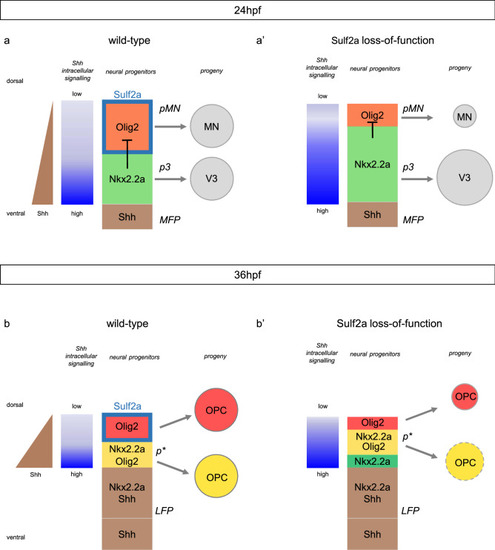
Model for Sulf2a function. Scheme showing Sulf2a and Shh-dependent gene expression in ventral neural progenitors during neuronal production (24 hpf, source has expanded in the former Nkx2.2a/p3 domain to form the lateral floor plate (LFP, brown). Immediately adjacent progenitors, i.e. the ventral-most cells of the Olig2/pMN domain, because they activate high-threshold Shh response, upregulate Nkx2.2a. At that stage, Nkx2.2a no more represses Olig2, leading to formation of the p* domain (yellow), populated by progenitors co-expressing Olig2 and Nkx2.2a. Sulf2a expression (turquoise blue frame) is excluded from p* cells but maintained in dorsally located Olig2 progenitors (red) where the enzyme, again, prevents high-threshold Shh response. Then, the two distinct populations of Olig2 progenitors, expressing Nkx2.2a (yellow) or not (red) generate the myelinating (yellow) and non-myelinating (red) OPC, respectively. In 36 hpf |