
- Title
-
CRISPR-Cas9 Knockdown and Induced Expression of CD133 Reveal Essential Roles in Melanoma Invasion and Metastasis
- Authors
- Simbulan-Rosenthal, C.M., Dougherty, R., Vakili, S., Ferraro, A.M., Kuo, L.W., Alobaidi, R., Aljehane, L., Gaur, A., Sykora, P., Glasgow, E., Agarwal, S., Rosenthal, D.S.
- Source
- Full text @ Cancers

Preferential survival and growth of MACS-sorted CD133(+) cells in mixed population xenografts, and sustained CD133 expression after reprogramming. GFP- CD133(+) and DsRed-CD133(−) cells were isolated by MACS ( |
Preferential survival and growth of MACS-sorted CD133(+) cells in mixed population xenografts, and sustained CD133 expression after reprogramming. GFP- CD133(+) and DsRed-CD133(−) cells were isolated by MACS ( |
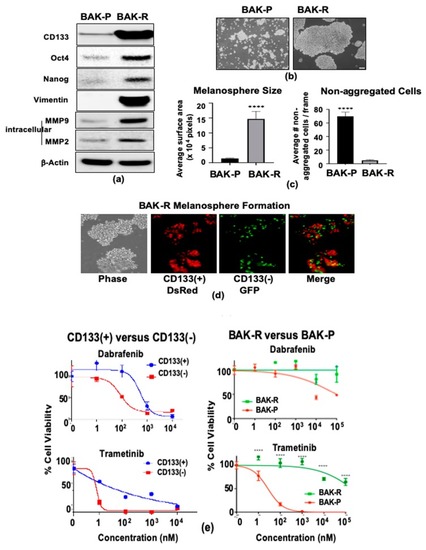
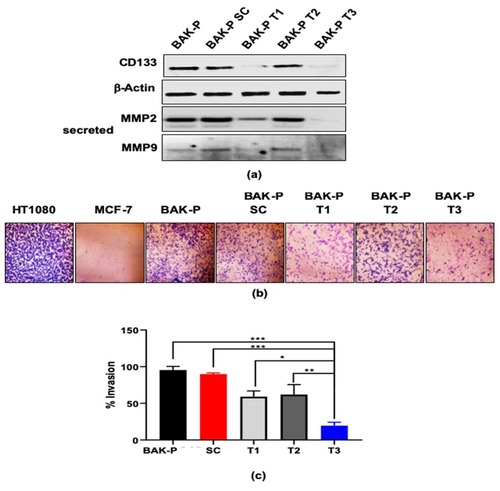
Compared to BAK-P, BAK-R cells strongly express markers of cancer stem cells (Oct4, Nanog), EMT (vimentin), and invasion (MMP2 and MMP9) as shown by immunoblot analysis ( |
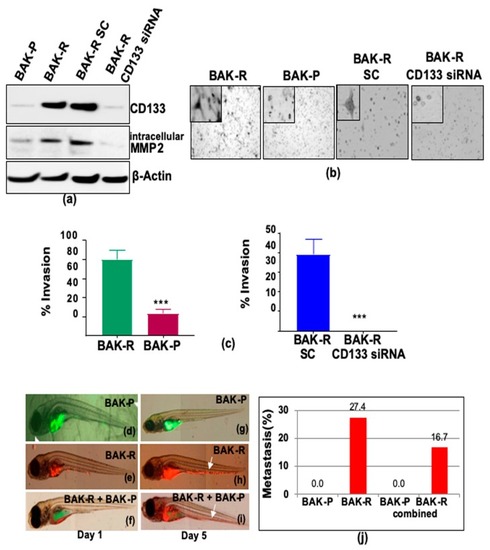
BAK-R cells exhibit increased invasion and metastasis in transwell invasion and zebrafish assays, compared to BAK-P ( |
( |
( |
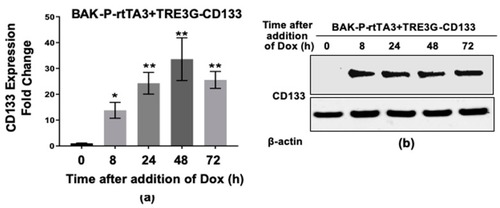
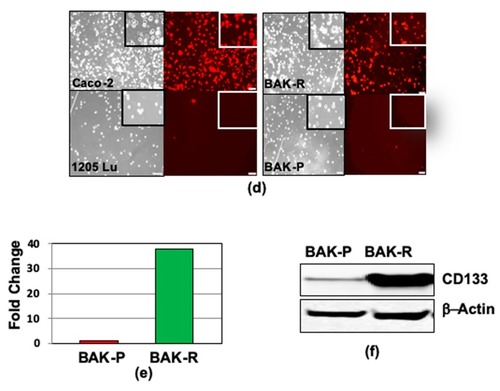
Dox-inducible CD133 expression in BAK-P cells as verified by qPCR ( |
Dox-inducible CD133 expression in BAK-P cells as verified by qPCR ( |