
- Title
-
A non-cell-autonomous actin redistribution enables isotropic retinal growth
- Authors
- Matejčić, M., Salbreux, G., Norden, C.
- Source
- Full text @ PLoS Biol.
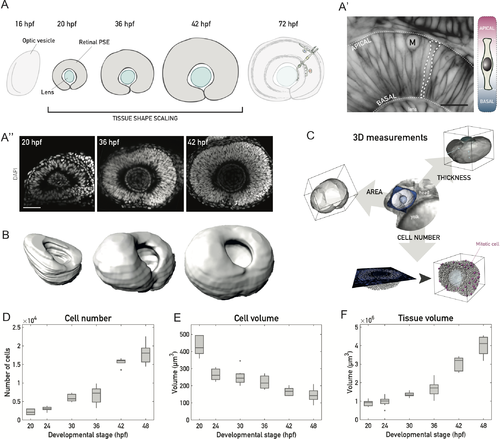
A 3D tissue-wide analysis allows cell-level investigation of tissue shape maintenance during vertebrate retinal PSE growth. (A) Schematic of vertebrate retinal development. After the optic vesicle forms the optic cup, cells in the retinal PSE proliferate as the tissue maintains its shape (20–42 hpf) to ultimately give rise to the laminated neuronal retina. (A’) The developing vertebrate retina is a PSE. Left: Optical slice through the retinal PSE at approximately 30 hpf, with a single cell outlined (dashed white line). Apical and basal surfaces of the tissue are outlined (dashed white lines). Cell membranes are labeled by Tg(actb1::HRAS-EGFP). Scale bar: 20 μm. Right: Schematic of a cell in the retinal PSE. The apical endfoot is shown at the top, the basal endfoot at the bottom (thin white dashed lines). (A”) Representative images of the retinal PSE in stages of proliferative growth. Nuclei are labeled with DAPI. Scale bar: 50 μm. (B) Examples of 3D surfaces for the retinal PSE tissue-wide growth analysis, shown for 20 hpf, 36 hpf, and 42 hpf. Surfaces were manually segmented, rendered, and analyzed using Imaris 8.3 (Bitplane). Related to S1 Movie. (C) Three exemplary parameters (tissue surface area, thickness, cell number) analyzed in the 3D characterization of size and shape of the retinal PSE (see Materials and methods). Middle: brightfield image of the anterior zebrafish body, with the head and a portion of the yolk sac visible. A 3D surface of the retinal PSE, segmented out from the surrounding tissue (blue), is overlaid to the brightfield image for orientation. In the representation of the tissue thickness (cell height) analysis, the light blue lines mark 2 (out of 5) positions at which thickness was measured in 3D. In the representation of the cell number analysis, mitotic cells (“M”) are visualized as magenta spheres and all other cells (interphase) as white spheres. (D) Total cell number increase during retinal PSE growth. (E) Cell volume decrease, as measured and corrected from mitotic cell volumes. (F) Tissue volume increase from manually segmented retinal tissues. N = 10 samples/stage for all plots. On boxplots, the central mark marks the median, the bottom and top box limits indicate the 25th and 75th percentile, respectively, the whiskers indicate the most extreme data points that are not considered outliers, and outliers are plotted as points. (Underlying data can be found at DOI: 10.5281/zenodo.1316912; /Matejcic-et-al_2018/Data/F1_2_3D_S12BD34.csv.). hpf, hours post fertilization; PSE, pseudostratified epithelium. |
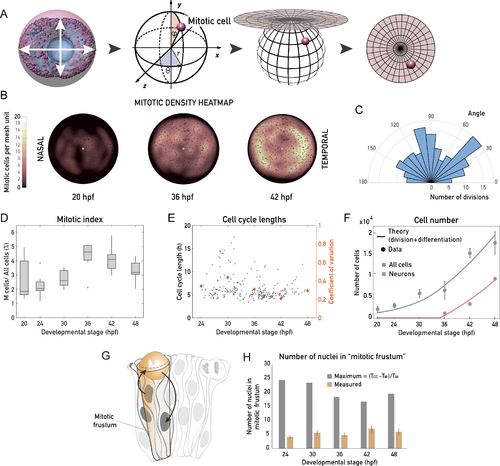
Retinal PSE growth is not strongly oriented, is homogeneous, and is unconstrained by the apical surface area. (A) Schematic of the mitotic distribution workflow to generate 2D mitotic density heatmaps; 3D Cartesian coordinates of every mitotic cell (see Materials and methods) were transformed into polar, spherical coordinates, which were then projected into 2 dimensions using a density-preserving azimuthal projection tool. (B) Typical 2D heatmaps of mitotic densities at 20 hpf, 36 hpf, and 42 hpf, obtained by transformations in (A). N = 10 samples/stage. (C) Rose plot of division angles, analyzed from samples 24–42 hpf. N = 15 embryos. Related to S2 Movie. (D) The mitotic index through development, calculated as the fraction of mitotic cells of all retinal PSE cells in a 3D tissue-wide retinal sample. (E) Cell cycle lengths of progenitor retinal PSE cells, analyzed by manual tracking of 254 cells from 20 embryos. Related to S3 Movie. The developmental stage on the x-axis is the middle point of the cell cycle, in hpf. Times on the x-axis are the CoVs for each stage plotted as orange diamonds (right y-axis). Data for CoV were binned as stage ± 3 h. (F) Total number of cells in the retina (gray points, as in Fig 1D) and number of committed progenitors/neurons (pink points) from data in S2 Fig. Gray and pink lines: theoretical cell and theoretical neuron number, assuming a constant rate of division and a 35% probability of dividing progenitors to produce 2 committed progenitors/neurons after 35 hpf (see S1 Text). Data points are plotted as mean ± SD. (G) Schematic representation of PSE tissue architecture, with apical mitoses (see also S3 Fig), migrating nuclei (arrows), and the mitotic frustum. The mitotic frustum is depicted as a truncated conical unit below the rounded mitotic cell. (H) Number of cells under the rounded mitotic cell. Measured values are calculated from tissue-wide nuclear density and mitotic frustum volume in each developmental stage (N = 10 samples/stage, see Materials and methods). Maximal possible number of cells is calculated as the time during which nuclei are absent from the apical surface (TCC − TM), divided by TM in each stage (see Materials and methods). (Underlying data can be found at DOI: 10.5281/zenodo.1316912; for panel B at /Matejcic-et-al_2018/Tools/MitoticDistribution/Positions_data/, for panel D at /Matejcic-et-al_2018/Data/F1_2_3D_S12BD34.csv, for panel E at /Matejcic-et-al_2018/Data/F3E.csv, panel H at /Matejcic-et-al_2018/Data/F3H.csv and F3H_4A.csv. The theoretical analysis for panel F can be found at /Matejcic-et-al_2018/Theory/Data analysis_essentials.nb.). CoV, coefficient of variation; hpf, hours post fertilization; PSE, pseudostratified epithelium; TCC, total cell cycle time; TM, duration of mitosis. |
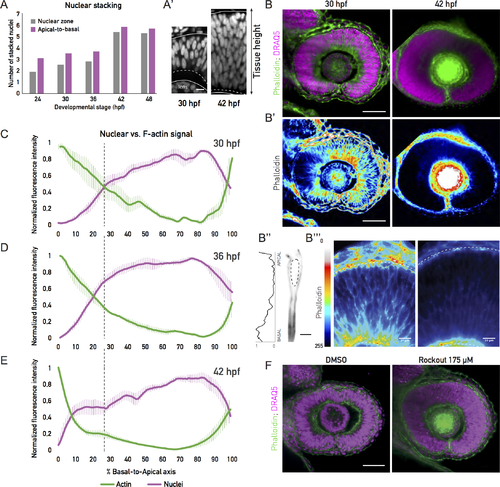
A tissue-wide basolateral actin accumulation establishes a basal nuclear exclusion zone. (A) Number of stacked nuclei along the apicobasal axis of the retinal PSE. Number in the nuclear zone was calculated from nuclear stainings by dividing the thickness of the zone of the nuclear signal by the average long axis of the nucleus. Apical-to-basal number of layers was calculated as total tissue height divided by the average nuclear long axis. (A’) Image of the basal nuclear exclusion zone in the first growth phase (30 hpf; square bracket, dashed line) and its absence in the second growth phase (42 hpf; dashed line). Solid lines mark the apical and basal tissue surface. Nuclear staining: DRAQ5. Scale bar: 10 μm. (B) Tissue-wide basolateral actin accumulation (green) and the nuclear zone (magenta) at 30 and 42 hpf. (B’) Lookup table indicates minimal and maximal phalloidin signal values from (B). Scale bar in (B) and (B’): 50 μm. (B”) Phalloidin signal in a manually segmented PSE cell, showing basolateral accumulation on the single-cell level. Dashed line outlines the cell nucleus. Scale bar: 5 μm. Left: Normalized basal-to-apical phalloidin signal intensity along the lateral cell membrane of cell on right. (B”’) Zoom-in on the apicobasal tissue axis in (B’). Dashed lines indicate apical and basal tissue surfaces. Lookup table indicates minimal and maximal phalloidin signal values. Scale bar: 10 μm. (C), (D), (E) Normalized average intensity distributions of phalloidin (green) and DRAQ5 (magenta) signal in the tissue volume along the apicobasal axis of the retinal PSE at 30 hpf (C), 36 hpf (D), and 42 hpf (E). Dashed black lines indicate border of basal exclusion zone and actin accumulation at 30 hpf. Values in each sample are normalized to minimum and maximum values. Data are shown as mean ± SEM; 5–9 samples/stage. (F) Rockout-treated and 0.3% DMSO-treated retinal PSE at 36 hpf. Rockout treatment (175 μM) was started at 30 hpf (see S6 Movie). (Underlying data can be found at DOI: 10.5281/zenodo.1316912; for panel A at /Matejcic-et-al_2018/Data/F3H_4A.csv, for panels C-E at /Matejcic-et-al_2018/Data/F4CDE_6BC.csv.). DRAQ5, deep red anthraquinone 5; hpf, hours post fertilization; PSE, pseudostratified epithelium. |
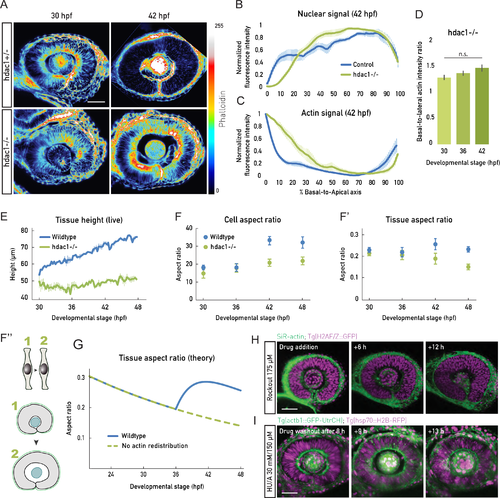
Actin redistribution enables cell elongation in concert with cell proliferation. (A) Phalloidin signal before (30 hpf) and after (42 hpf) actin redistribution in the heterozygous (hdac1+/−) controls and hdac1−/− samples. Basolateral actin accumulation does not redistribute in hdac1−/− samples (bottom panels). Lookup table indicates minimal and maximal phalloidin signal values. (B), (C) Normalized average intensity distributions of DRAQ5 (B) and phalloidin (C) signal in control (blue) and hdac1−/− (green) samples at 42 hpf. Values in each sample are normalized to minimum and maximum values. Data are shown as mean ± SEM; 3–9 samples/stage. (D) Basal-to-lateral phalloidin signal intensity ratios in hdac1−/− samples; 5 samples/stage. Mean ± SD. Mann-Whitney test, p-value 0.3095. (E) Tissue height measurements from live embryos (light sheet time lapses) for wild-type (blue) and hdac1−/− (green) samples related to S5 Movie). N = 2/condition. (F) Cell shape analyzed as aspect ratios from mean cell cross-sectional area and height in wild-type (blue) and hdac1−/− (green) samples; 3–10 samples/stage. Wild-type data same as in Fig 2E. (F’) Tissue shape analyzed as aspect ratios from mean tissue area and height in wild-type (blue) and hdac1−/− (green) samples; 3–10 samples/stage. Wild-type data same as in Fig 2E. (F”) Schematic representation of the unchanged cell aspect ratio during hdac1−/− retinal PSE growth and perturbed tissue shape. Related to S5 Movie. (G) Prediction of simplified theory for the tissue aspect ratio |
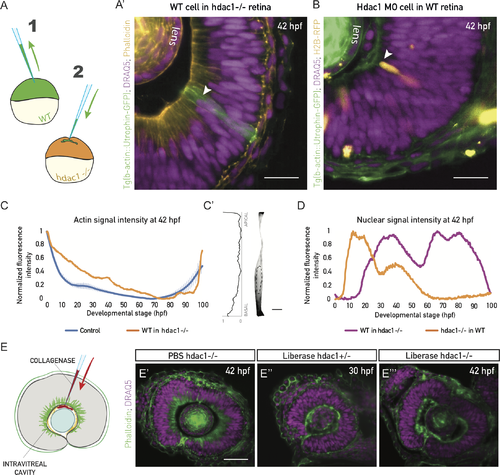
Actin reorganization and cell height increase are non-cell autonomous and ECM dependent. (A) Schematic of the cell transplantation experiment. Blastomeres from Tg(actb1::GFP-UtrCH) embryos (1) were transplanted into acceptor hdac1−/− embryos (2) between high and sphere stage. (A’) WT cells in hdac1−/− tissues do not redistribute basolateral actin, nor do they increase their height at 42 hpf (green cells, arrowhead). Actin is labeled with phalloidin (orange) and nuclei with DRAQ5 (magenta). N = 5 embryos. Scale bar: 50 μm. (B) Mosaic injection of hdac1 MO into Tg(actb1::GFP-UtrCH). Cells with hdac1 MO were co-injected with H2B-RFP mRNA. Their basal actin zone disappears at the same time as in the WT (orange cells, arrowhead). Actin is labeled with phalloidin (green) and nuclei with DRAQ5 (magenta). N = 5 embryos. Scale bar: 50 μm. (C) Normalized fluorescence intensity profiles of phalloidin signal along the apicobasal axis of the transplanted clone marked in (A’). Control plot is same data as Fig 4E. (C’) Phalloidin signal in a manually segmented transplanted PSE cell from sample in (A’), showing basolateral accumulation on the single-cell level. Dashed line outlines the cell nucleus. Scale bar: 5 μm. Left: Normalized basal-to-apical phalloidin signal intensity along the lateral cell membrane of cell on right. (D) Normalized fluorescence intensity profile of nuclear signal (H2B, orange line) along the apicobasal axis of the hdac1-deficient clone in (B) and nuclear signal (DRAQ5, magenta line) in the transplanted clone in (A’). (E) ECM integrity was perturbed by injecting 0.5 mg/ml of collagenase (Liberase) into the intravitreal cavity of the zebrafish eye. (E’) The basal actin accumulation in hdac1−/− tissues remains intact when PBS is injected as control. (E”) Collagenase abolishes the basal accumulation in 30 hpf control hdac1+/− embryos. (E”’) Collagenase abolishes the basal actin accumulation in 42 hpf hdac1−/− tissues. E’-E”’, actin is labeled with phalloidin (green), nuclei are labeled with DRAQ5 (magenta). (Underlying data for panels C and D can be found at DOI: 10.5281/zenodo.1316912; /Matejcic-et-al_2018/Data/F7CD.csv.). DRAQ5, deep red anthraquinone 5; ECM, extracellular matrix; hdac1, histone-deacetylase 1; hpf, hours post fertilization; MO, morpholino; PSE, pseudostratified epithelium; WT, wild type. |
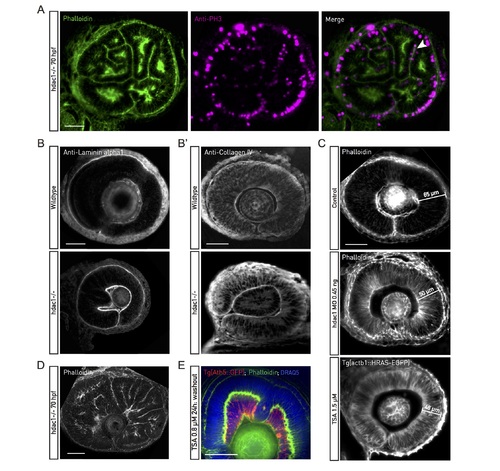
Hdac1−/− characterization. (A) Phalloidin (green) and PH3 antibody (magenta) staining of F-actin and mitotic cells in about 70 hpf hdac1−/− retinal PSE. Apical mitoses, junctional belts, and basal actin accumulation are preserved in the folded tissue. (B) Laminin-alpha1 and Collagen IV (B’) antibody staining of wild-type and hdac1−/− retinal tissues around 48 hpf. An intact basal lamina underlies the basal surface of the hdac1−/− retinal PSE. (C) Tissue thickness does not increase in Hdac1 morpholino-injected or TSA-treated retinal PSE (42 hpf). (D) Phalloidin staining of approximately 72 hpf hdac1−/−. Epithelial folds form throughout the retinal PSE. (E) Tg(Ath5::GFP) retinas (red) treated with TSA at 24 hpf for 24 h and stained with phalloidin (green) and DRAQ5 (blue). The medium was replaced after 24 h. The PSE differentiates by 70 hpf despite tissue shape perturbed by folds. Consequently, neuronal layers are perturbed, as well. Scale bars: 50 μm for all images. DRAQ5, deep red anthraquinone; Hdac1, histone-deacetylase 1; hpf, hours post fertilization; PH3, phosphorylated histone H3; PSE, pseudostratified epithelium; TSA, Trichostatin-A. |
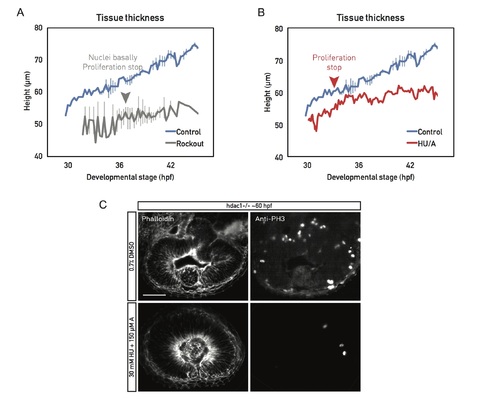
Proliferation is necessary for cell height increase. (A) Cell height of live (light sheet time lapses) Rockout-treated wild-type retinal PSE (gray). Sample was incubated in 175 μM Rockout for the entirety of the imaging session. Around 37 hpf, the basolateral actin accumulation was abolished, nuclei filled the basal positions, and proliferation stopped. Related to S6 Movie. (B) Cell height of live (light sheet time lapses) wild-type retinal PSE, treated with a combination of cell cycle inhibitors HU/A (red); 30 mM HU and 150 μM of A were added at the beginning of the movie (30 hpf). Proliferation stopped 3 h later (red arrowhead). Cell height did not increase further after cells cycle was blocked. Control plots (blue) in (A) and (B) are data from Fig 6E. (C) Top panels: Retinas of mutant fish treated with DMSO fold and proliferate normally (PH3 staining). Bottom panels: Mutant retinas treated with HU/A do not fold when their proliferation is inhibited but do maintain the basolateral actin accumulation. Scale bar: 50 μm. (Underlying data can be found at DOI: 10.5281/zenodo.1316912; /Matejcic-et-al_2018/Data/FS7A.csv and FS7B.csv.). A, aphidicolin; hpf, hours post fertilization; HU, hydroxyurea; PH3, phosphorylated histone H3; PSE, pseudostratified epithelium. |