
Fig. 1
- ID
- ZDB-FIG-180914-6
- Publication
- Matejčić et al., 2018 - A non-cell-autonomous actin redistribution enables isotropic retinal growth
- Other Figures
- All Figure Page
- Back to All Figure Page
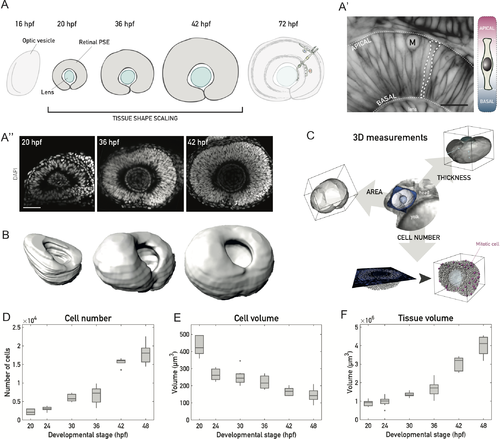
A 3D tissue-wide analysis allows cell-level investigation of tissue shape maintenance during vertebrate retinal PSE growth. (A) Schematic of vertebrate retinal development. After the optic vesicle forms the optic cup, cells in the retinal PSE proliferate as the tissue maintains its shape (20–42 hpf) to ultimately give rise to the laminated neuronal retina. (A’) The developing vertebrate retina is a PSE. Left: Optical slice through the retinal PSE at approximately 30 hpf, with a single cell outlined (dashed white line). Apical and basal surfaces of the tissue are outlined (dashed white lines). Cell membranes are labeled by Tg(actb1::HRAS-EGFP). Scale bar: 20 μm. Right: Schematic of a cell in the retinal PSE. The apical endfoot is shown at the top, the basal endfoot at the bottom (thin white dashed lines). (A”) Representative images of the retinal PSE in stages of proliferative growth. Nuclei are labeled with DAPI. Scale bar: 50 μm. (B) Examples of 3D surfaces for the retinal PSE tissue-wide growth analysis, shown for 20 hpf, 36 hpf, and 42 hpf. Surfaces were manually segmented, rendered, and analyzed using Imaris 8.3 (Bitplane). Related to S1 Movie. (C) Three exemplary parameters (tissue surface area, thickness, cell number) analyzed in the 3D characterization of size and shape of the retinal PSE (see Materials and methods). Middle: brightfield image of the anterior zebrafish body, with the head and a portion of the yolk sac visible. A 3D surface of the retinal PSE, segmented out from the surrounding tissue (blue), is overlaid to the brightfield image for orientation. In the representation of the tissue thickness (cell height) analysis, the light blue lines mark 2 (out of 5) positions at which thickness was measured in 3D. In the representation of the cell number analysis, mitotic cells (“M”) are visualized as magenta spheres and all other cells (interphase) as white spheres. (D) Total cell number increase during retinal PSE growth. (E) Cell volume decrease, as measured and corrected from mitotic cell volumes. (F) Tissue volume increase from manually segmented retinal tissues. N = 10 samples/stage for all plots. On boxplots, the central mark marks the median, the bottom and top box limits indicate the 25th and 75th percentile, respectively, the whiskers indicate the most extreme data points that are not considered outliers, and outliers are plotted as points. (Underlying data can be found at DOI: 10.5281/zenodo.1316912; /Matejcic-et-al_2018/Data/F1_2_3D_S12BD34.csv.). hpf, hours post fertilization; PSE, pseudostratified epithelium. |