
Fig. 4
- ID
- ZDB-FIG-180914-8
- Publication
- Matejčić et al., 2018 - A non-cell-autonomous actin redistribution enables isotropic retinal growth
- Other Figures
- All Figure Page
- Back to All Figure Page
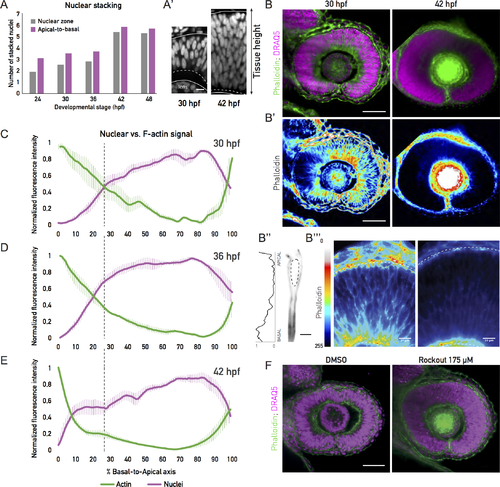
A tissue-wide basolateral actin accumulation establishes a basal nuclear exclusion zone. (A) Number of stacked nuclei along the apicobasal axis of the retinal PSE. Number in the nuclear zone was calculated from nuclear stainings by dividing the thickness of the zone of the nuclear signal by the average long axis of the nucleus. Apical-to-basal number of layers was calculated as total tissue height divided by the average nuclear long axis. (A’) Image of the basal nuclear exclusion zone in the first growth phase (30 hpf; square bracket, dashed line) and its absence in the second growth phase (42 hpf; dashed line). Solid lines mark the apical and basal tissue surface. Nuclear staining: DRAQ5. Scale bar: 10 μm. (B) Tissue-wide basolateral actin accumulation (green) and the nuclear zone (magenta) at 30 and 42 hpf. (B’) Lookup table indicates minimal and maximal phalloidin signal values from (B). Scale bar in (B) and (B’): 50 μm. (B”) Phalloidin signal in a manually segmented PSE cell, showing basolateral accumulation on the single-cell level. Dashed line outlines the cell nucleus. Scale bar: 5 μm. Left: Normalized basal-to-apical phalloidin signal intensity along the lateral cell membrane of cell on right. (B”’) Zoom-in on the apicobasal tissue axis in (B’). Dashed lines indicate apical and basal tissue surfaces. Lookup table indicates minimal and maximal phalloidin signal values. Scale bar: 10 μm. (C), (D), (E) Normalized average intensity distributions of phalloidin (green) and DRAQ5 (magenta) signal in the tissue volume along the apicobasal axis of the retinal PSE at 30 hpf (C), 36 hpf (D), and 42 hpf (E). Dashed black lines indicate border of basal exclusion zone and actin accumulation at 30 hpf. Values in each sample are normalized to minimum and maximum values. Data are shown as mean ± SEM; 5–9 samples/stage. (F) Rockout-treated and 0.3% DMSO-treated retinal PSE at 36 hpf. Rockout treatment (175 μM) was started at 30 hpf (see S6 Movie). (Underlying data can be found at DOI: 10.5281/zenodo.1316912; for panel A at /Matejcic-et-al_2018/Data/F3H_4A.csv, for panels C-E at /Matejcic-et-al_2018/Data/F4CDE_6BC.csv.). DRAQ5, deep red anthraquinone 5; hpf, hours post fertilization; PSE, pseudostratified epithelium. |