
- Title
-
Recovery of shape and size in a developing organ pair
- Authors
- Green, A.A., Mosaliganti, K.R., Swinburne, I.A., Obholzer, N.D., Megason, S.G.
- Source
- Full text @ Dev. Dyn.
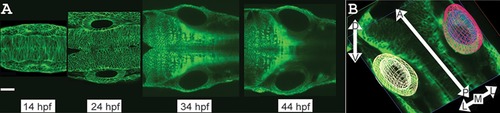
Tracking development of wild?type zebrafish ear pairs. A: Time series of zebrafish (actb2:membrane?citrine) ear pairs: single confocal planes at 14, 24, 34, 44 hpf. Dorsal view. Scale bar?=?50?�m. See Supplementary Movie S1 for 3D visualizations of ear shapes and volumes. B: The 3D representation of an ear pair. White arrows indicate axes: Contours outline left ear (yellow) and lumen (off?white); right ear (red) and lumen (blue). |
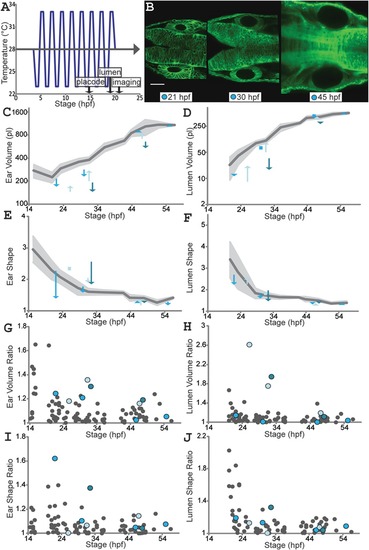
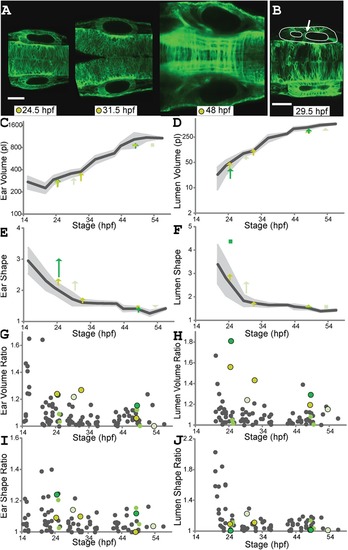
Environmental stress causes asymmetries in developing ear pairs that are later corrected. A: Temperature fluctuation protocol: temperature changes from 23?33?�C (or vice versa) every hour from 4?20 hpf. B: Single confocal planes (actb2:membrane?citrine) for an individual (corresponding to cyan arrows and dots in C?J) following temperature fluctuation treatment. Scale bar?=?50?�m. See Supplementary Movie S2 for 3D visualizations of ear and lumen shapes and volumes. C?F: Ear (C) and lumen (D) volumes; ear (E) and lumen (F) shape ratios. Untreated wild?type mean values (dark?gray) and SD (light?gray) as in Figure 3. Each arrow connects left and right ear values for one fish at one timepoint (two to four timepoints for three individuals, one color per individual). Squares replace arrows shorter than an arrowhead. G?J: B/S ratios for ear (G) and lumen (H) volumes; ear (I) and lumen (J) shape ratios (untreated wild?type as in Fig. 3, gray dots). Colors match individuals in B?F. See also Supplementary Table S2. |
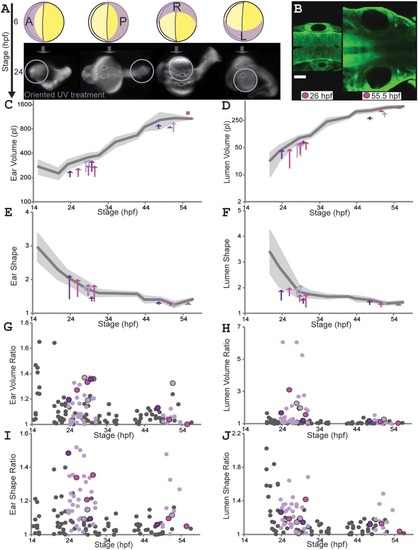
Localized UV treatment creates temporary asymmetry in ear and lumen size and shape. A: Oriented UV (302?nm) treatments. 6 hpf: yellow circles represent eggs (yolk, deep yellow; embryo, light yellow); UV orientation from Anterior, Posterior, Left or Right; purple crescents represent expected UV penetration. 24 hpf: embryos (oriented as 6 hpf; ears outlined white, lumens black) show damage near UV source (purple circles; note anterior UV often causes additional defects and early death). B: Early (26 hpf) and late (55.5 hpf) ear pairs for an individual (actb2:membrane?citrine) UV?treated on its left (same color used for same individual, C?J). Scale bar?=?50?�m. Supplementary Movie S3 shows 3D visualizations of ear and lumen shapes and volumes. C?F: Ear (C) and lumen (D) volumes; ear (E) and lumen (F) shape ratios. Untreated wild?type mean values (dark?gray) and SD (light?gray) as in Figure 3. Each arrow connects left (treated) and right ear values for one fish at one timepoint (three to four timepoints for three individuals, one color per individual). Squares replace arrows shorter than an arrowhead. G?J: B/S ratios for ear (G) and lumen (H) volumes; ear (I) and lumen (J) shape ratios (untreated wild?type as in Fig. 3, gray dots). Black?outlined colored dots match individuals in B?F. See Supplementary Table S2. |
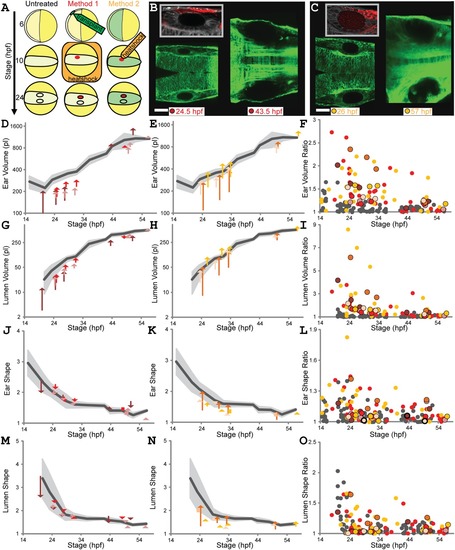
Transient local reduction of Fgf signaling affects size and symmetry of developing ears. A: Localized heatshock methods. Yellow circles eggs, anterior oriented left. Untreated: wild?type development 6?24 hpf (embryos, light yellow; ears, black?outlined ellipses). Method 1 (transplant+heatshock): 6 hpf transplant donor hsp70:dnfgfr1a?EGFP cells (green) to actb2:membrane?mCherry2 host embryo; 10 hpf heatshock activates hsp70:dnfgfr1a?EGFP (red). Method 2 (local heatshock): hsp70:dnfgfr1a?EGFP;actb2:membrane?mCherry2 embryo (green). The 10 hpf localized heatshock activates hsp70:dnfgfr1a?EGFP (red). The 24 hpf treated ears smaller than untreated. B,C: Ear pairs ?24 hpf;?>?43 hpf (confocal planes); Methods 1 (B), 2 (C). Scale bar?=?50?�m. Inserts: magnifications of treated ears, GFP?expressing cells false?colored red. D?O: LR differences and B/S ratios. Untreated wild?type means (dark gray) and SD (light gray) as in Figure 3. Ear volumes: Methods 1 (D), 2 (E). Each arrow connects left (treated) and right ear values for one fish at one timepoint (four to six timepoints for three individuals per treatment; one color per individual). Squares replace arrows shorter than an arrowhead. B/S ratios for ear volumes (F). Untreated wild?type gray dots as in Figure 3; treated individuals, red (Method 1) and orange (Method 2) dots; individuals from B?E, black?outlined dots. Lumen volume (G?I), ear shape ratio (J?L), and lumen shape ratio (M?O), for individuals in D?F. See Supplementary Movies S4and S5, and Supplementary Table S2. |
Recovery of ear shape and size asymmetry after modulation of Fgf8a. A,B: Single confocal planes for hsp70:fgf8a;actb2:membrane?citrine individuals heatshocked at 12 hpf. Scale bar?=?50?�m. Supplementary Movie S6 shows 3D visualizations of ear and lumen shapes and volumes. Dot/arrow colors mark the same individuals in C?J. White arrow (B) points to epithelial tissue bisecting an elongated lumen. C?F: Ear (C) and lumen (D) volumes; ear (E) and lumen (F) shape ratios. Untreated wild?type mean values (dark gray) and SD (light gray) as in Figure 3. Each arrow connects left (treated) and right ear values for one fish at one timepoint (three to four timepoints for three individuals, one color per individual). Squares replace arrows shorter than an arrowhead. G?J: B/S ratios for ear (G) and lumen (H) volumes; ear (I) and lumen (J) shape ratios (untreated wild?type as in Fig. 3, gray dots). Black?outlined colored dots match individuals in A?F. See Supplementary Table S2. |