
|
Fig. 4
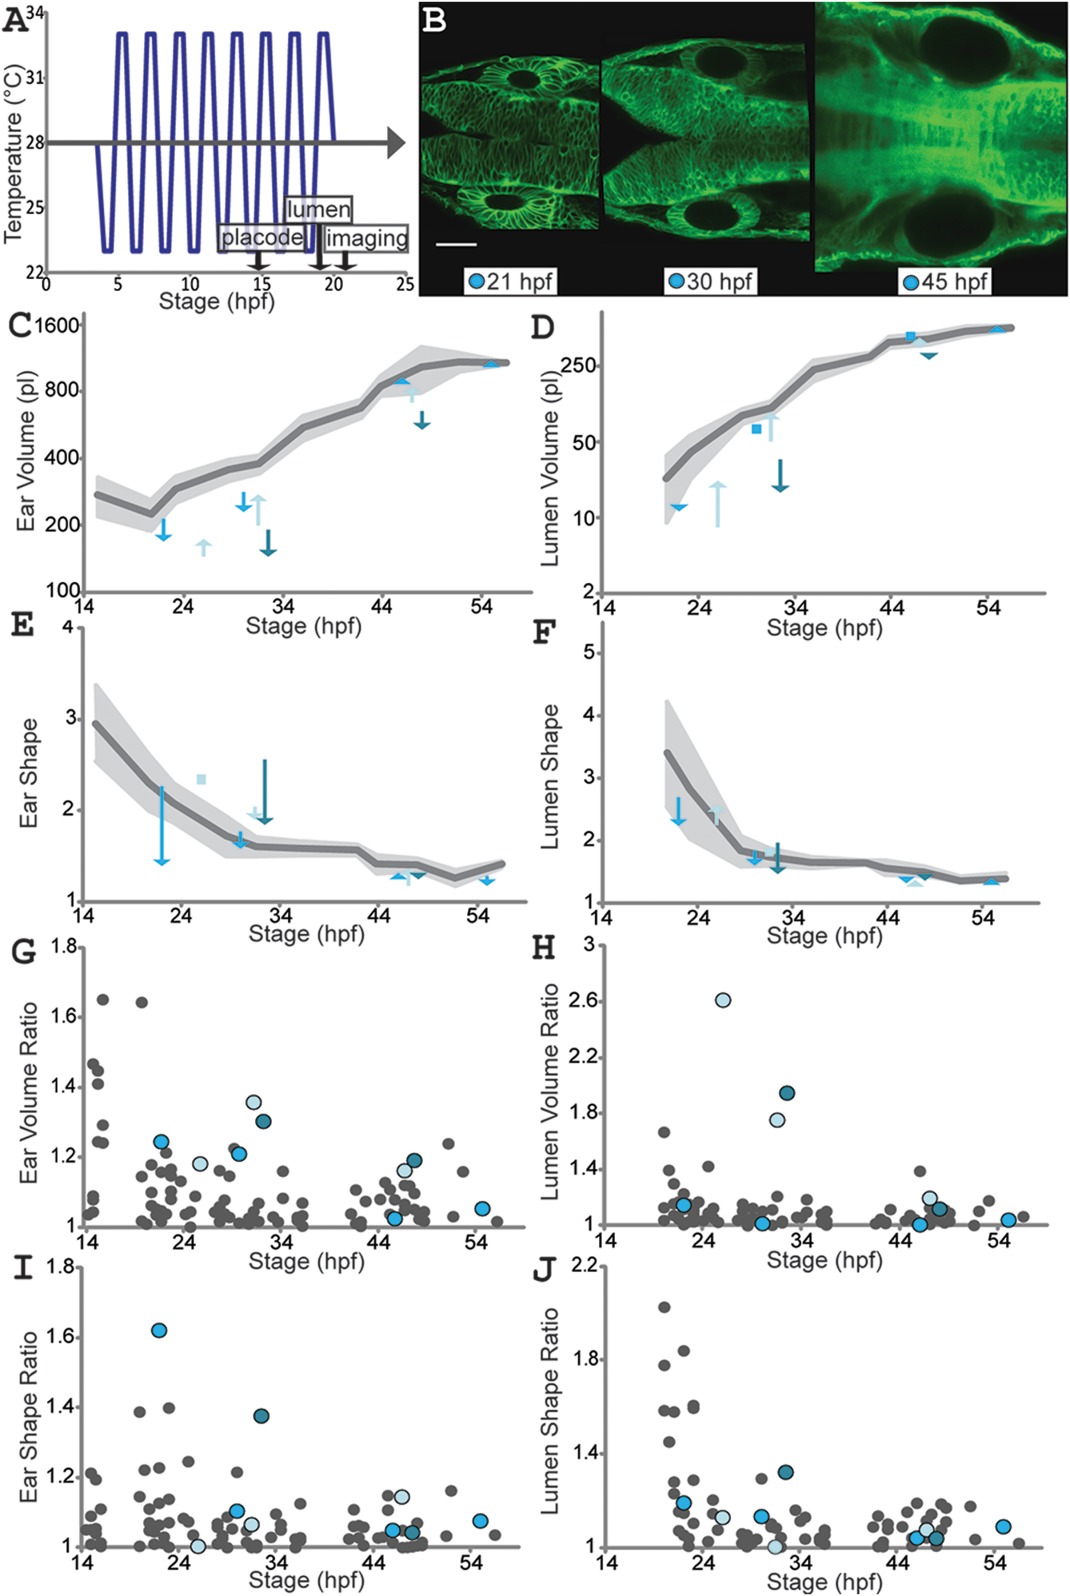
Environmental stress causes asymmetries in developing ear pairs that are later corrected. A: Temperature fluctuation protocol: temperature changes from 23–33 °C (or vice versa) every hour from 4–20 hpf. B: Single confocal planes (actb2:membrane‐citrine) for an individual (corresponding to cyan arrows and dots in C–J) following temperature fluctuation treatment. Scale bar = 50 µm. See Supplementary Movie S2 for 3D visualizations of ear and lumen shapes and volumes. C–F: Ear (C) and lumen (D) volumes; ear (E) and lumen (F) shape ratios. Untreated wild‐type mean values (dark‐gray) and SD (light‐gray) as in Figure 3. Each arrow connects left and right ear values for one fish at one timepoint (two to four timepoints for three individuals, one color per individual). Squares replace arrows shorter than an arrowhead. G–J: B/S ratios for ear (G) and lumen (H) volumes; ear (I) and lumen (J) shape ratios (untreated wild‐type as in Fig. 3, gray dots). Colors match individuals in B–F. See also Supplementary Table S2.