
Image
|
Figure Caption
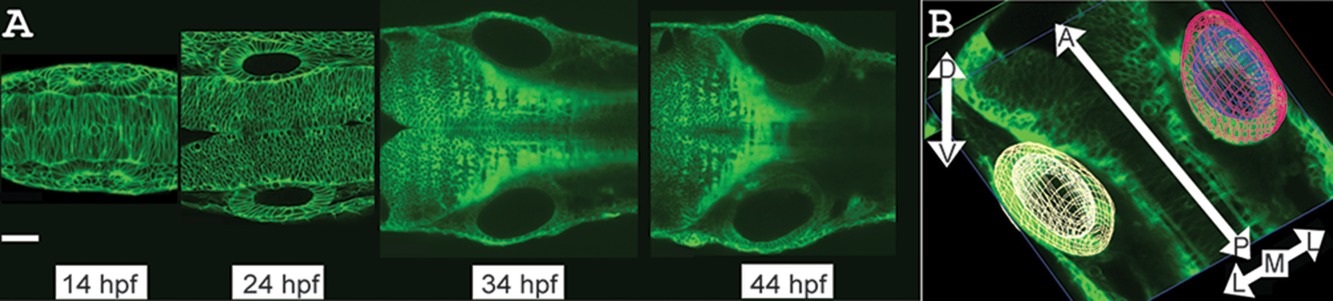
Fig. 1
Tracking development of wild‐type zebrafish ear pairs. A: Time series of zebrafish (actb2:membrane‐citrine) ear pairs: single confocal planes at 14, 24, 34, 44 hpf. Dorsal view. Scale bar = 50 µm. See Supplementary Movie S1 for 3D visualizations of ear shapes and volumes. B: The 3D representation of an ear pair. White arrows indicate axes: Contours outline left ear (yellow) and lumen (off‐white); right ear (red) and lumen (blue).
Acknowledgments
This image is the copyrighted work of the attributed author or publisher, and
ZFIN has permission only to display this image to its users.
Additional permissions should be obtained from the applicable author or publisher of the image.
Full text @ Dev. Dyn.