
|
Fig. 6
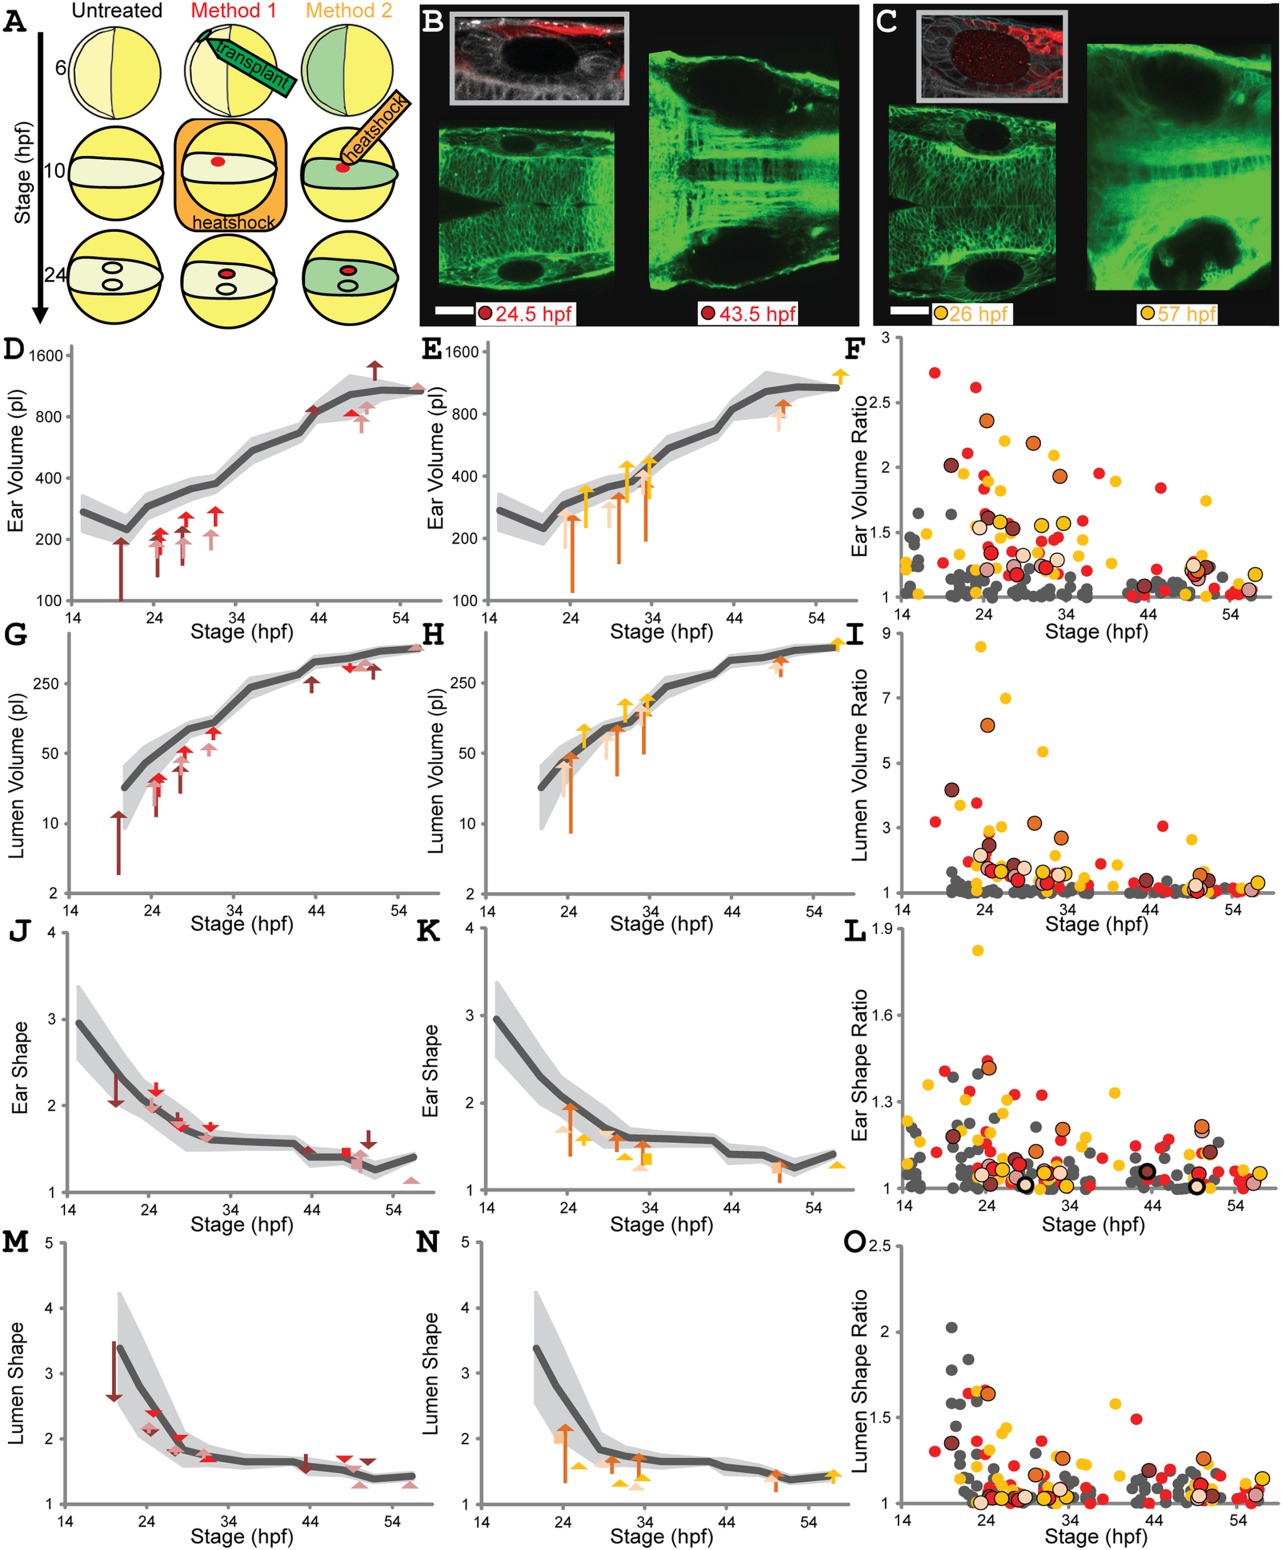
Transient local reduction of Fgf signaling affects size and symmetry of developing ears. A: Localized heatshock methods. Yellow circles eggs, anterior oriented left. Untreated: wild‐type development 6–24 hpf (embryos, light yellow; ears, black‐outlined ellipses). Method 1 (transplant+heatshock): 6 hpf transplant donor hsp70:dnfgfr1a‐EGFP cells (green) to actb2:membrane‐mCherry2 host embryo; 10 hpf heatshock activates hsp70:dnfgfr1a‐EGFP (red). Method 2 (local heatshock): hsp70:dnfgfr1a‐EGFP;actb2:membrane‐mCherry2 embryo (green). The 10 hpf localized heatshock activates hsp70:dnfgfr1a‐EGFP (red). The 24 hpf treated ears smaller than untreated. B,C: Ear pairs ∼24 hpf; > 43 hpf (confocal planes); Methods 1 (B), 2 (C). Scale bar = 50 µm. Inserts: magnifications of treated ears, GFP‐expressing cells false‐colored red. D–O: LR differences and B/S ratios. Untreated wild‐type means (dark gray) and SD (light gray) as in Figure 3. Ear volumes: Methods 1 (D), 2 (E). Each arrow connects left (treated) and right ear values for one fish at one timepoint (four to six timepoints for three individuals per treatment; one color per individual). Squares replace arrows shorter than an arrowhead. B/S ratios for ear volumes (F). Untreated wild‐type gray dots as in Figure 3; treated individuals, red (Method 1) and orange (Method 2) dots; individuals from B–E, black‐outlined dots. Lumen volume (G–I), ear shape ratio (J–L), and lumen shape ratio (M–O), for individuals in D–F. See Supplementary Movies S4and S5, and Supplementary Table S2.