
- Title
-
fgf1 is required for normal differentiation of erythrocytes in zebrafish primitive hematopoiesis
- Authors
- Songhet, P., Adzic, D., Reibe, S., and Rohr, K.B.
- Source
- Full text @ Dev. Dyn.

Genomic position and expression of zebrafish fgf1. A: Tree showing the similarity of selected fibroblast growth factor (FGF) family members. The tree is based on the alignment of deduced amino acids. Only the conserved core region of FGFs has been aligned to allow a comparison to distant family members as well. c, chick; f, Fugu; m, mouse; x, Xenopus; z, zebrafish. B: Comparison of the genomic position of zebrafish fgf1 on linkage group 14 (chromosome 14) and human FGF1 on chromosome 5q. Critically deleted regions (CDRs) are indicated in 5q. Selected genes syntenic in both species are shown for the CDR and flanking regions. C-L: Expression of fgf1 and gata1 (H) during zebrafish embryogenesis. Stages are indicated bottom left. C-F,I,K: Whole-mount in situ hybridization. G,H,J,L: Sections of stained embryos. C,D,I,K: Lateral views. E,F: Dorsal views. G: A section through the posterior trunk region of an embryo as in F. H: A corresponding section of an embryo stained for gata1 as a marker for hematopoietic tissue. The position of sections in J and L are indicated by black lines in I and K, respectively. i, ICM; n, notochord; s, somite |
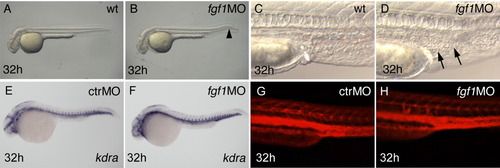
fgf1 morphants show accumulation of blood cells in the posterior intermediate cell mass (ICM), despite apparently normal vessel pattern and initially normal hematopoiesis. Stages are indicated bottom left, manipulation of embryos top right, and marker expression bottom right. A-D,G,H: Live embryos. Occasionally, fgf1 morphants have a kinked tail (arrowhead in B). Arrows in D point to accumulating cells in the ICM. E,F: The vessel marker kdra is normally expressed. G,H: Microangiography results in a grossly normal pattern of fgf1 morphants (rhodamine-dextran fluorescence of injected embryos, trunk, lateral view). |

fgf1 morphants show altered gata1 and ika expression. Labeling of panels is as in Figure 2>. A-D: Early gata1 expression is normal in fgf1 morphants. E-H: Strong and persistent gata1-expressing cells in fgf1 morphants. Arrows point to the blood sinus covering the yolk, arrowheads to gata1-expressing cells in the intermediate cell mass (ICM) or elsewhere in the embryo. I-L: Close-ups and sections through the posterior ICM at 35 hours postfertilization (hpf; gata1). M,N:ika expression is normal in fgf1 morphants at 24 hpf. O,P: At 32 hpf, strong ika expression persists in fgf1 morphants, whereas it is down-regulated in control or wild-type embryos. Arrows/arrowheads as in E-H. Q-T: Cells strongly expressing ika accumulate in the ICM of fgf1 morphants. Close-ups and sections through the posterior ICM at 32 hpf. n, notochord EXPRESSION / LABELING:
|

fgf1 morphants have persistent high levels of gata1 expression at 35 hours postfertilization (hpf). The 35 polymerase chain reaction (PCR) cycles with gata1-specific primers amplify visibly less product from control morphants than from fgf1 morphants at 35 hpf (standard reverse transcriptase-quantitative PCR). Comparison to 24 hpf control and fgf1 morphants indicates continuously high gata1 expression in fgf1 morphants, but a down-regulation in control morphants, confirming the in situ hybridization data. bactin2 (beta actin2) expression is used as control. Identical results were observed in three independent sets of experiments. |

Erythrocyte differentiation is delayed in fgf1 morphants, but cell proliferation and cell death appears to be normal. Labeling of panels is as in Figure 2>. A-H:o-dianisidine staining is missing at 32 hpf in fgf1 morphants (arrows in C,D), but is present at 48 hpf, albeit at reduced levels (arrows in G,H). I-L: The differentiation markers βe1 and alas2 are continuously expressed in fgf1 morphants (arrows point to the posterior intermediate cell mass (ICM), highlighting the accumulation of extra cells in fgf1 morphants). M-P: Immunohistochemistry with an antibody detecting phosphorylated histone-3 (H3) detects mitotic cells. No increased cell proliferation can be detected in fgf1 morphants. Q-T: terminal deoxynucleotidyl transferase-mediated deoxyuridinetriphosphate nick end-labeling (TUNEL) assay detects cell death. No increased cell death can be observed in fgf1 morphants. H3, antibody staining with anti-phosphorylated histone. |

Treatment of embryos with the fibroblast growth factor (FGF) signaling blocker su5402 partially phenocopies fgf1 morphants. Labeling of panels is as in Figure 2. Embryos shown here were treated with 10 μM su5402 from 22 hours postfertilization (hpf) to fixation at 32 hpf. A-D: Expression of gata1 and ika is increased and can be found in an enlarged domain in the intermediate cell mass (ICM) in fgf1 morphants (arrows in B,D). E-H:o-Dianisidine staining shows that, in contrast to fgf1 morphants, erythrocyte differentiation is not significantly delayed in su5402-treated embryos. Cells accumulating in the posterior ICM differentiate (arrow in H). EXPRESSION / LABELING:
|