
|
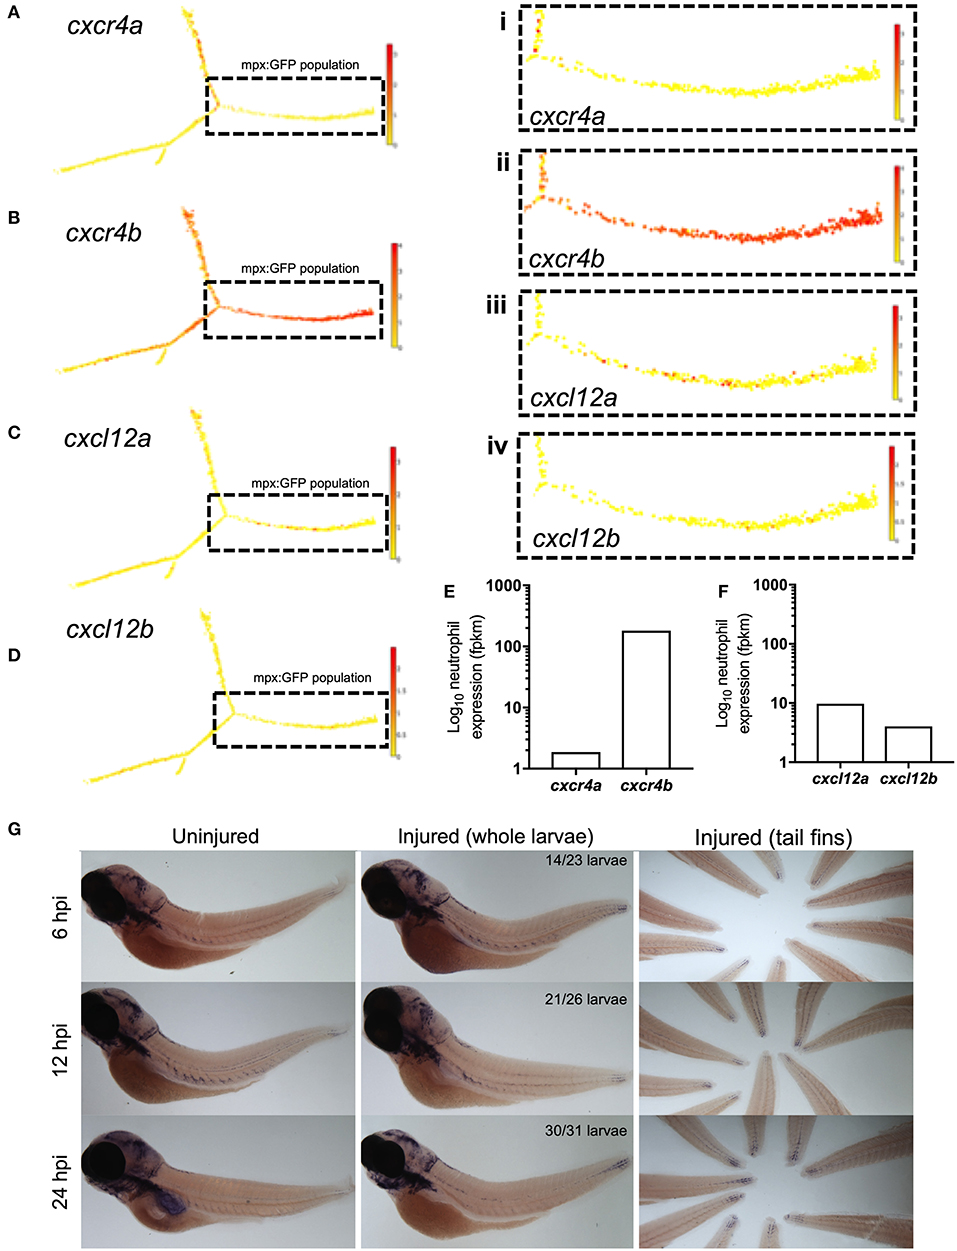
Fig. 1
cxcr4b and cxcl12a are expressed following tissue damage in zebrafish. (A–D) Single-cell gene expression profiles for cxcr4 and cxcl12 in the zebrafish blood lineage. Single cell gene expression values extracted from the Sanger BASiCz zebrafish blood atlas. Circles represent individual cells color coded where red is high expression and yellow is no expression. Neutrophil lineage (mpx:GFP positive) is highlighted by black dashed box and expanded in (i–iv). (E,F) RNA sequencing of FACS sorted GFP positive cells from TgBAC(mpx:GFP)i114 zebrafish larvae at 5 days post fertilization. FPKM values illustrate neutrophil expression of (E) cxcr4a and cxcr4b and (F)cxcl12a and cxcl12b. (G) Whole mount in situ hybridization using an antisense DIG labeled RNA probe for cxcl12a mRNA. Wildtype nacre zebrafish larvae were injured and fixed in PFA at 6, 12, and 24 h post injury, along with uninjured age-matched control larvae. Left and middle panels show whole zebrafish larvae at timepoints indicated, right panel shows tail fins of a representative experiment. Quantification shows number of larvae which look like representative image from 2 independent experiments.