
Fig. 2, S1
|
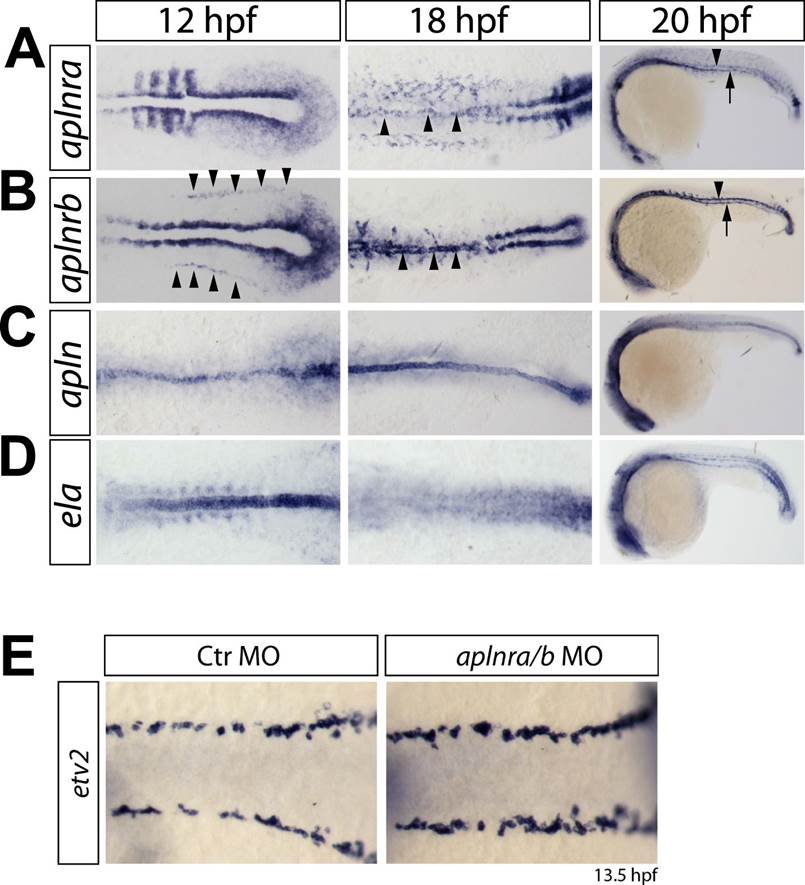
Fig. 2, S1 Expression of aplnra, aplnrb, apln and ela coincides with the formation of the DA and PCV.
(A–D) In situ hybridizations detecting expression of aplnra (A), aplnrb (B), apln (C) and ela (D) at the indicated time points (12 hpf, 18 hpf shown in dorsal views, 20 hpf in lateral views). aplnrs are expressed in the migrating angioblasts and continue to be expressed during formation of the DA and PCV. At 12 hpf, aplnrb is strongly expressed in the angioblasts (prior to migration, arrowheads) and within the lateral plate mesoderm and at the notochord somite boundary. aplnra expression is strong in the paraxial mesoderm (A). Both receptors are expressed in the angioblasts at 18 hpf (A, B, arrowheads) and in the developing axial vessels at 20 hpf (Arrowheads point to the DA, arrows to the PCV). Prior to angioblast migration apln and ela are both expressed by the notochord, with ela showing a much stronger expression (C, D). After angioblasts reached the midline (18 hpf, 20 hpf) only apln is still expressed by the notochord, whereas notochord derived ela expression is strongly reduced to absent. (E) Knockdown of aplnr does not influence the specification of angioblasts. In situ hybridizations detecting expression of the angioblast marker etv2 at 13.5 hpf (dorsal views).