
Fig. 1
|
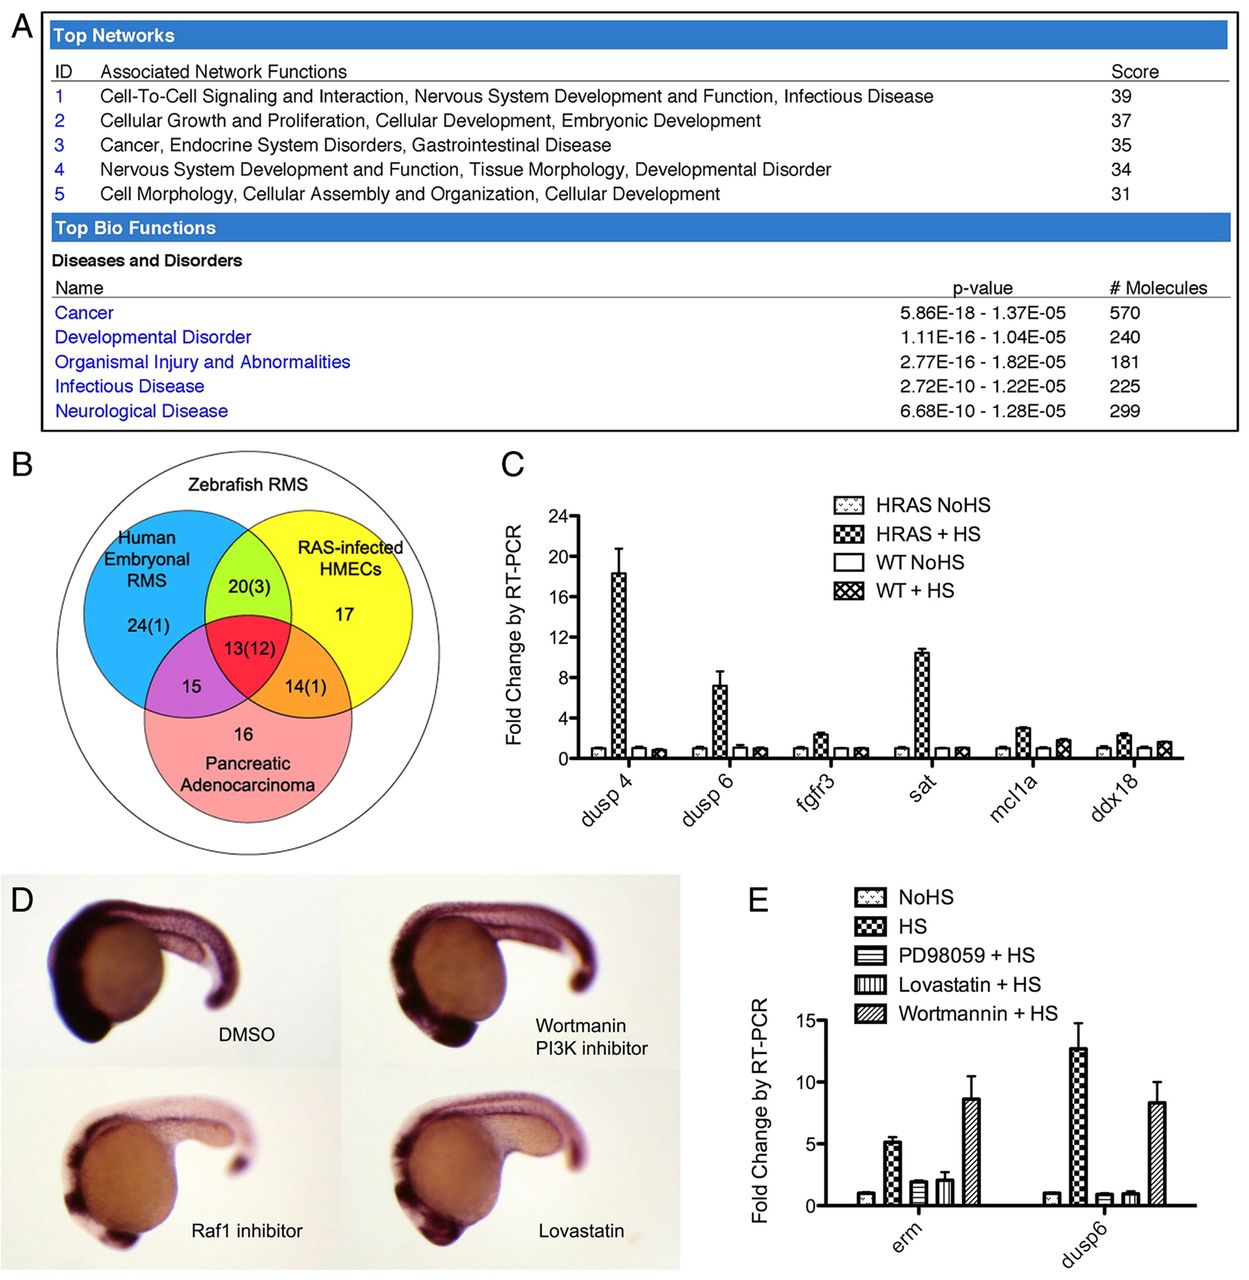
Fig. 1 Transient RAS action in Tg(hsp70-HRASG12V) zebrafish embryos resembles pathway activation during tumorigenesis. (A) Ingenuity pathway analysis output for the upregulated gene set identified on comparing Tg(hsp70-HRASG12V) embryos to wild-type zebrafish embryos following heat shock (log fold change >0.5 for top network and >0.7 for top diseases and disorders). (B) RAS signature gene list, defined as commonly upregulated genes in zebrafish RMS (white circle), human embryonal RMS (blue circle), human pancreatic adenocarcinoma (red circle) and RAS-infected HMECs (yellow circle). The total number of genes is shown, with the number tested in the 17-gene list in parentheses [adapted from Langenau et al. (Langenau et al., 2007)]. (C) RT-PCR analysis of six of the RAS signature genes in Tg(hsp70-HRASG12V) and wild-type embryos with and without heat shock. P<0.05 for each gene shown, HRAS+HS compared with other conditions. (D) ISH of erm. Transgenic embryos were incubated with various chemicals from 16 hpf, heat shocked at 18-19 hpf, and fixed at 24 hpf. DMSO, vehicle control. (E) RT-PCR analysis of erm and dusp6 expression levels in response to pathway-specific chemical inhibitors. Error bars indicate s.e.m. HS, heat shock; NoHS, no heat shock.