
IMAGE
Fig. 2
Image
|
Figure Caption
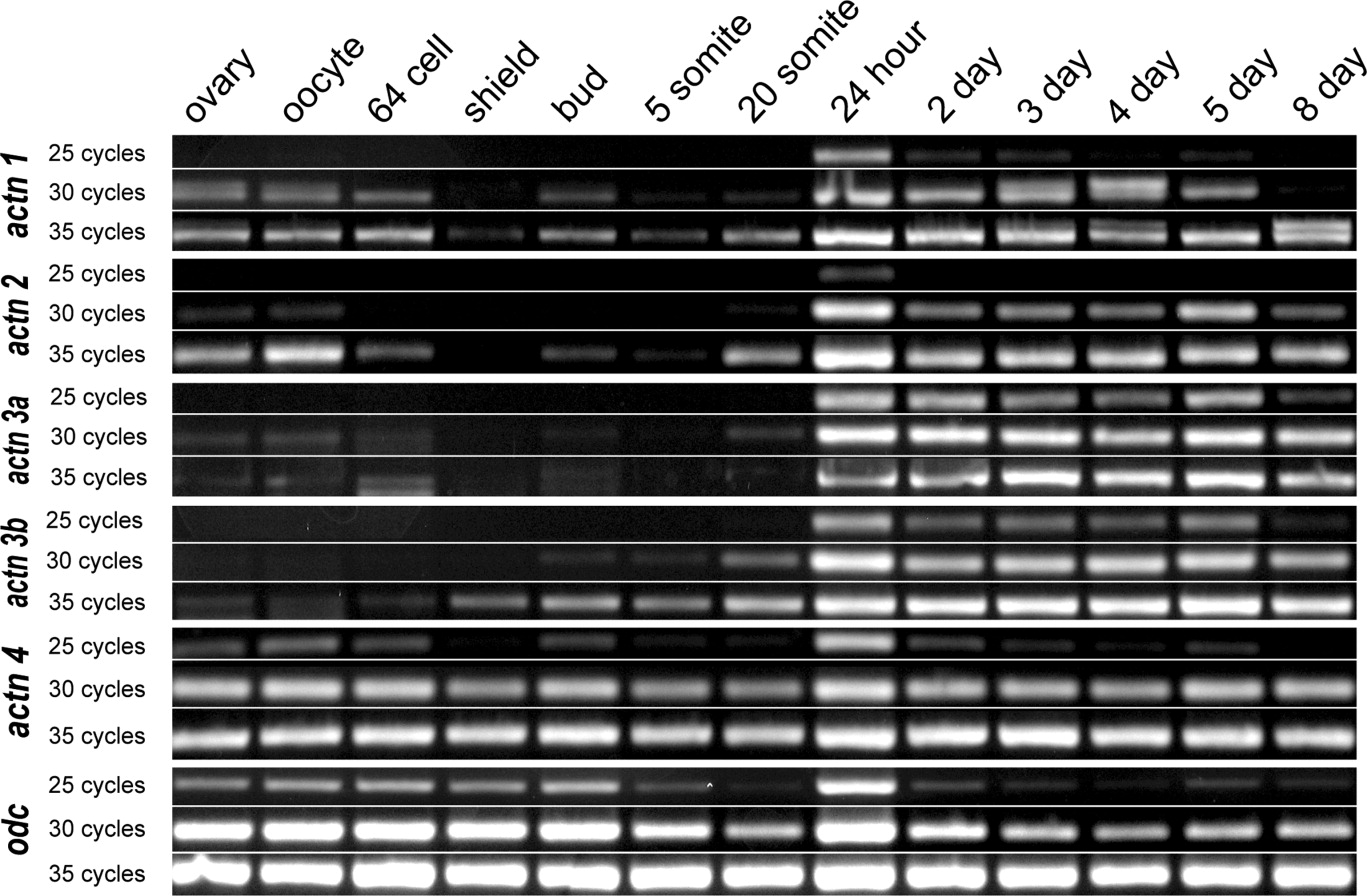
Fig. 2 Temporal expression profiles of zebrafish actinin genes as shown by semi-quantitative PCR. Each actinin gene shows a unique and dynamic regulation of expression through early development. cDNA samples used for each PCR reaction are indicated by column and range from adult ovary and oocytes to 8-dpf larval cDNA. The upper band of the actn1 doublet was sequenced to show it is a product from an unrelated locus.
Figure Data
Acknowledgments
This image is the copyrighted work of the attributed author or publisher, and
ZFIN has permission only to display this image to its users.
Additional permissions should be obtained from the applicable author or publisher of the image.
Full text @ Dev. Dyn.