
Fig. 3
|
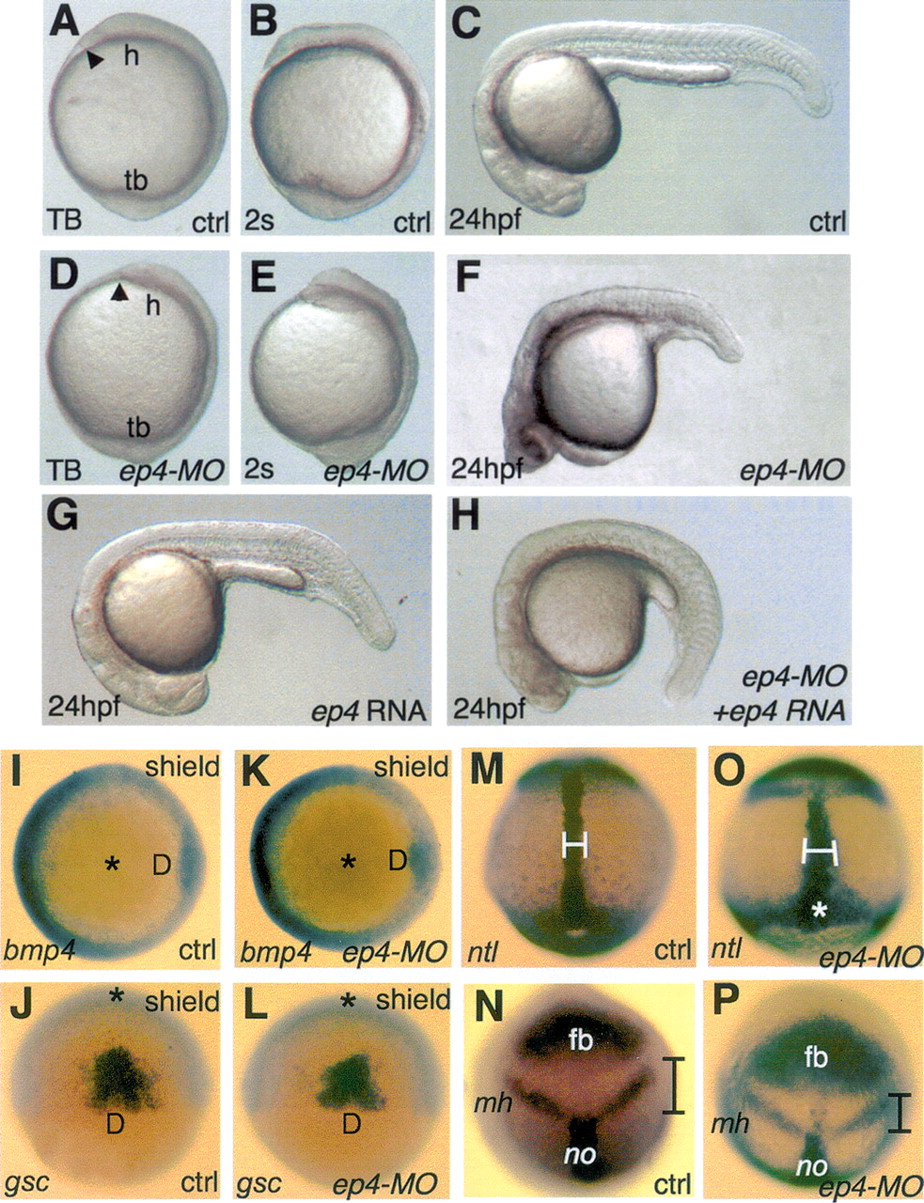
Fig. 3 EP4-deficient embryos exhibit convergence and extension defect during gastrulation. (A,B,D,E) Lateral view, dorsal to the right. (C,F,G,H) Lateral view, anterior to the left. (I,K) Animal view, dorsal to the right. (J,L) Dorsal view, animal pole to the top. (M,O) Dorsal view, anterior to the top. (N,P) Anterior view, dorsal to the bottom. (M,N) Boundaries indicate the width of the notochord. (N,P) Boundaries indicate the distance from the posterior end of the forebrain to the anterior end of the notochord. (A-C,I,J,M,N) Uninjected control. (D-F,H,K,L,O,P) ep4-MO2 (2 ng) injected embryos. (G,H) ep4 RNA (80 pg) injected embryos. (H) Embryos injected with ep4-MO2 (2 ng) + ep4 RNA (80 pg). (I,K) bmp4 expressions. (J,L) gsc expressions. (M,O) no tail (ntl) expressions. (N,P) six3, pax2, and ntl expressions. (h) Head; (tb) tailbud; (D) dorsal; (fb) forebrain; (mh) mid-hindbrain; (no) notochord. The arrowhead points to the location of the prechordal plate at the tailbud stage. The white star highlights the blastopore to illustrate delayed epiboly. The black star indicates the animal pole.