
Fig. 10
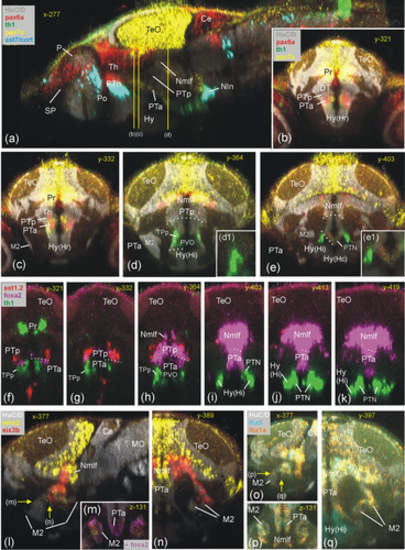
Basal prosomere P3 zebrafish gene expression (anterior part of posterior tuberculum, PTa). Sagittal (a) and four consecutive transverse sections characterize PTa through pax7a (b-e), with pax6a, sst7, and th1 expression for orientation. Consecutive transverse sections (f–k) show foxa2 expression and relationship to dopamine cells (th1 positive), with sst1.2 expression for orientation. Gene expression in laterally migrated cell masses M2 of PTa (M2 = mature preglomerular complex) is shown in three atlas planes (l-n: emx2 and six3b expression; o-q: lhx5 and lhx1a expression). Ce, cerebellum; Hy, basal hypothalamus; Hy(Hc), caudal periventricular hypothalamic zone; Hy(Hi), intermediate periventricular hypothalamic zone; Hy(Hr), rostral periventricular hypothalamic zone; M2, early migrated posterior tubercular area (preglomerular complex); MO, medulla oblongata; NIn, interpeduncular nucleus; Nmlf, region of the nucleus of the medial longitudinal fascicle; P, pallium; Po, preoptic area; poc, postoptic commissure; Pr, pretectum; PTa, anterior part of posterior tuberculum; PTh, prethalamus; PTN, posterior tuberal nucleus; PTp, posterior part of posterior tuberculum; PVO, paraventricular organ; SP, subpallium; TeO, tectum opticum; TPp, periventricular posterior tubercular nucleus. |