
Fig. 3
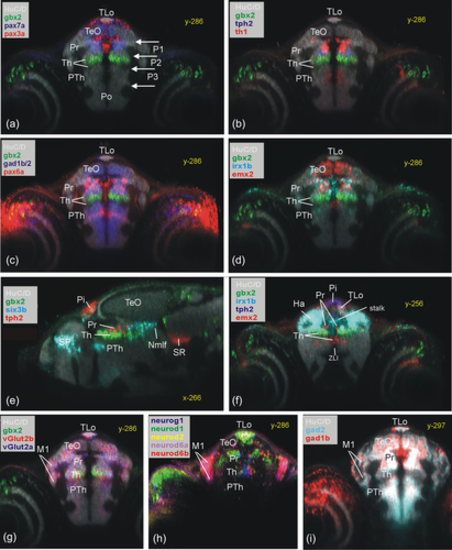
Periventricular pretectal (Pr) zebrafish gene expression shown in transverse sections (a–d, f: pax7a, pax3a, pax6a, th1, tph2, gad1b, gad2, irx1b, emx2). Transverse sections (g and h) show pretectal gene expression in laterally migrated cell mass M1 (vglut2a, vglut2b, neurog1, neurod1, neurod2, neurod6a, and neurod6b). (e) Sagittal section shows rostral and caudal pretectal gene expression (six3b). (f) Transverse section shows gene expression in most rostral pretectum. Note that HuC/D shows early mature neurons and is used as a general anatomical background stain in most panels, while gbx2 expression in the thalamus is used as a specific reference point (both also in other figures). Ha, habenula; M1, early migrated pretectal area; Nmlf, region of the nucleus of the medial longitudinal fascicle; Pi, pineal; Po, preoptic area; Pr, pretectum; PTh, prethalamus; SR, superior raphe; Th, thalamus; TLo, torus longitudinalis; ZLI, zona limitans intrathalamica. |