FIGURE

Figure 4—figure supplement 2.

ID
ZDB-FIG-231101-6
Publication
Bellegarda et al., 2023 - The Reissner fiber under tension in vivo shows dynamic interaction with ciliated cells contacting the cerebrospinal fluid
Other Figures
All Figure Page
Back to All Figure Page
Figure 4—figure supplement 2.

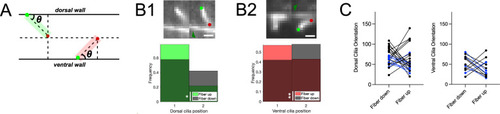
Motile cilia position profile differs with Reissner fiber dorsoventral oscillation position.

(A) Schematic illustrating the geometric calculation of ciliary orientation versus the dorsoventral axis. (B1) Top: two k-means clusters of a single optical section in the sagittal plane demonstrating a dorsal motile cilium brushing along the RF in the central canal in a 3 dpf Tg(sspo:sspo-GFP;β-actin:Arl13b-GFP) paralyzed larva out of the streaming video acquired at 40 Hz using spinning disk confocal microscopy setup equipped with a 40X objective. Dark green arrow indicates the RF. Light green and red dots indicate the base and tip of the cilium, respectively. Rostral to the left, ventral displayed on the bottom. Bottom: frequency distributions of the two dorsal cilium clusters (found by performing k-means clustering using two clusters for RF position in the dorsoventral axis) plotted according to the two RF clusters corresponding to oscillatory up and down movements. The cilium and RF positions were found dependent (Fisher’s exact test: p < 0.05). (B2) Top: two k-means clusters of a single optical section in the sagittal plane demonstrating a ventral motile cilium brushing along the RF for the same paralyzed larva in (A1). Bottom: frequency distributions of the two k-means ventral cilium clusters plotted according to the RF position (k-means clusters corresponding to up or down RF movement in the dorsoventral axis). The cilium and RF positions were found dependent (Fisher’s exact test: p < 0.01). (C) Left: orientation of the two k-means clusters (average) for dorsal cilia plotted as a function of the RF position in the dorsoventral axis (two k-means clusters representing up and down movements), whose histograms (as in B1) were statistically significant (blue; N=7 dorsal cilia across 5 fish) and those that were not statistically significant (black; N=15 dorsal cilia across 5 fish). Right: orientation of the two k-means clusters (average) for ventral cilia plotted as a function of the RF position in the dorsoventral axis (two k-means clusters representing up and down movements of the fiber), whose histograms (as in B2) were statistically significant (blue; N=4 ventral cilia across 5 fish) and those that were not statistically significant (black; N=9 ventral cilia across 5 fish). * p < 0.05, ** p < 0.01. Scale bar is 2 μm (B1, B2).

Expression Data

Expression Detail
Antibody Labeling
Phenotype Data

Phenotype Detail
Acknowledgments
This image is the copyrighted work of the attributed author or publisher, and ZFIN has permission only to display this image to its users. Additional permissions should be obtained from the applicable author or publisher of the image. Full text @ Elife