|
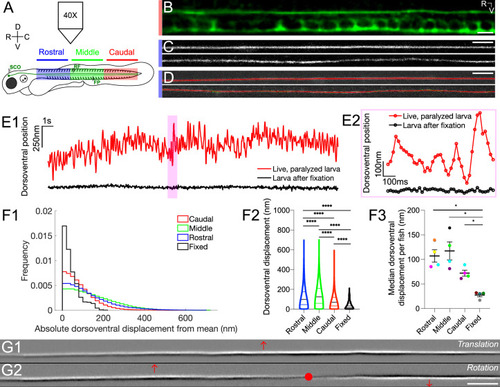
The Reissner fiber under tension exhibits spontaneously dynamic behavior over the dorsoventral axis in the central canal. (A) Spinning disk confocal microscopy setup using a 40X objective with 3 dpf Tg(sspo:sspo-GFP) zebrafish larvae for live imaging. Schema of zebrafish larva designates rostral (blue), middle (green) and caudal (red) sections, corresponding to somites 1–10, 11–20, 21–30, respectively. (B) Immunohistochemistry with anti-GFP antibodies in 3 dpf Tg(sspo:sspo-GFP) larva after fixation shows RF with the floor plate (FP) visible within the caudal somites of the spinal cord. (C) Live imaging snapshot of RF in the rostral somites of a 3 dpf Tg(sspo:sspo-GFP) paralyzed, living larva (top) and larva after fixation (bottom). (D) Example tracking of continuous motion of RF through the development of a script to model its movements in the dorsoventral axis. (E1) Example trace of the change in dorsoventral position of RF in one paralyzed, living larva (red) and another euthanized larva after fixation (black) over a 25 s timelapse acquired at 40 Hz. Data was discretized in 2 μm bins along the rostrocaudal axis before plotting. (E2) Zoomed-in display of the highlighted area marked on E1, showing a trace of the dorsoventral position of RF over 1 s for both the paralyzed, living larva and the euthanized larva after fixation, respectively, with circles indicating the sampling points. (F1) Displacement in the dorsoventral axis for paralyzed larvae (N=4 rostral, 4 middle, 4 caudal recordings) is significantly larger than that of fixed (N=4 recordings) larvae on average median ± standard deviation provided hereafter: in paralyzed living larvae = 74 nm ± 68 nm versus in fixed larvae = 32 nm ± 39 nm; unpaired two-tailed t-test: p < 10-4. The displacement was calculated from data that was discretized in 2 μm bins along the rostrocaudal axis. (F2) Dorsoventral displacement of RF is significantly different among rostral, middle and caudal segments of paralyzed larvae (on average median ± standard deviation in rostral somites = 100 nm ± 103 nm versus in middle somites = 125 nm ± 108 nm versus in caudal somites = 70 nm ± 68 nm versus in fixed larvae = 32 nm ± 39 nm; Tukey’s HSD Test for multiple comparisons: p < 10-4). (F3) Median dorsoventral displacement of RF from the mean position per fish, with each color representing a different fish (on average mean of median dorsoventral displacement ± standard deviation in rostral somites = 107 nm ± 25 nm versus in middle somites = 117 nm ± 37 nm versus in caudal somites = 72 nm ± 12 nm versus in fixed larvae = 28 nm ± 7 nm; Tukey’s HSD Test for multiple comparisons: p < 0.05). (G1–G2) A principal component analysis was computed on one image sequence of one fish (with each image corresponding to one observation) to understand the most significant movements of the fiber. The G1 component corresponds to a dorsoventral translation (the fiber borders are black on the ventral side, white on the dorsal side) and G2 to a small local rotation around a point (in red). These two components account respectively for 21.9% (G1) and 3.4% (G2) of the total temporal variability in the video. * p < 0.05, **** p < 10-4. Scale bar is 10 μm (B, C, D) and 20 μm (G1, G2).
|