|
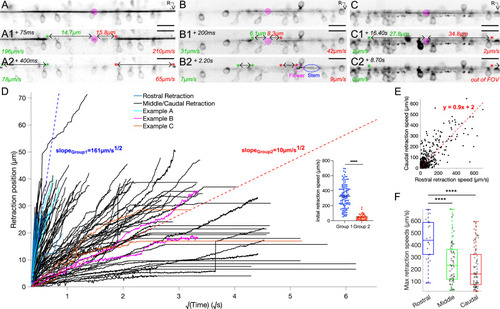
Reissner fiber photoablation reveals different modes of relaxation under tension (A) Frame-by-frame instantaneous speed calculations for the rostral and caudal ends of the cut RF during retraction after photoablation by UV-pulsed laser in 3 dpf triple transgenic Tg(sspo:sspo-GFP;pkd2l1:tagRFP;pkd2l1:GCaMP5G) paralyzed larvae. Pink spiral indicates the site of RF ablation. Instantaneous speeds of the fiber for both rostral and caudal ends were calculated using the change in position of the fiber between two consecutive frames, divided by the exposure time (25 ms) and converted to μm/s. (A1, A2) specifically depict an example of a fiber in the ‘rigid case’, where the fiber retracts straight on both ends without distortion. (B) Instantaneous speed calculations for both rostral and caudal ends of a cut fiber in the ‘relaxed case’, where there is distortion of the fiber (B1 left cut end, B2 right cut end) due to no more tension on one or both ends of the fiber. By analogy with the dynamics of DNA molecules, one can refer to the completely relaxed portion of the fiber as the ‘flower’, while the remaining taut portion of the fiber would be the ‘stem’. (C) Instantaneous speed calculations for both rostral and caudal ends of a cut fiber that remains stuck in the central canal, remaining in the field of view for about 25 s. (D) Retraction position plotted across the square root of time for all fish (N=74 fish from 7 independent clutches), color-coded to illustrate the examples in (A–C), and indicating if a flower was seen in the 38 s-long recordings along the rostrocaudal axis. D×ΔLL is provided by the slopes of the two dotted lines (blue and red), indicating a fast retraction or a slow retraction of the rostral and caudal ends of the cut fiber in the central canal. Inset: initial retraction speed (the distance the cut fiber retracted in between 50 ms and 75 ms after photoablation, after UV laser artifacts) is larger in the fibers classified under the fast retraction group than those in the slow retraction group. (E) Rostral and caudal ends of the fiber in cases with and without flowers plotted against each other, demonstrating that rostral and caudal end dynamics generally tend to mirror each other (N=74 fish). (F) Maximum retraction speed for rostral and caudal ends of the cut RF classified using the schema in Figure 1A, grouping the ablations that occurred in the rostral somites (N=9 fish), middle somites (N=34 fish), and caudal somites (N=34 fish). Mean for ablation in rostral somites = 448 μm/s ± 168 μm/s versus in middle somites = 253 μm/s ± 166 μm/s versus in caudal somites = 211 μm/s ± 165 μm/s; Tukey’s HSD Test for multiple comparisons: p < 10-4. ****p < 10-4. Scale bar is 10 μm (A, B,C).
|