|
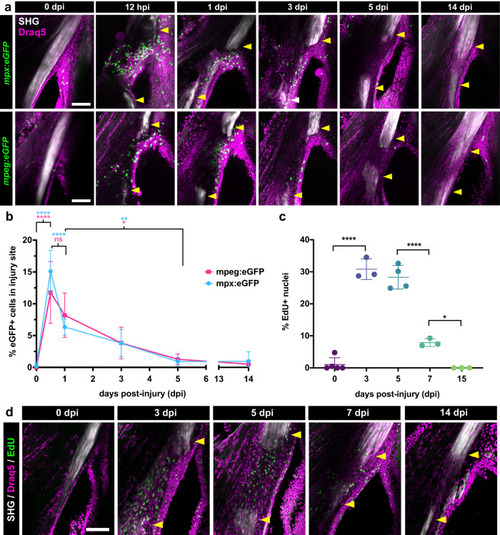
Tendon injury triggers a rapid innate immune response followed by a wave of cellular proliferation. a 2-photon imaging of regenerating tendons from mpx:eGFP (top row) or mpeg1:eGFP (bottom row) zebrafish at different time points post-injury to examine neutrophil and macrophage dynamics, respectively. SHG signal is overlaid along with a Draq5 nuclear counterstain. Yellow arrowheads denote severed tendon ends. Scale bar, 100 µm. b Quantification of the percentage of mpx:eGFP+ and mpeg1:eGFP+ cells out of total Draq5+ cells in the injury site during the first 2 weeks post-injury. One-way ANOVA analysis was employed for statistical analysis with Tukey’s multiple comparison tests between different time points. Sample sizes were as follows: mpx:eGFP – 0, 1, 14 dpi: N = 4; 0.5, 3, 5 dpi: N = 5; mpeg1:eGFP – 0.5 dpi: N = 6; 0, 1, 3 dpi: N = 5; 5 dpi: N = 4; 14 dpi: N = 3. ****p < 0.0001, **p < 0.01, *p < 0.05. c Quantification of the percentage of EdU+ cells out of total Draq5+ cells in the injured area at 0, 3, 5, 7, and 15 dpi. One-way ANOVA analysis was employed for statistical analysis with Tukey’s multiple comparison tests between time points. Sample sizes were as follows: 0 dpi: N = 5; 3, 7, 15 dpi: N = 3; 5 dpi: N = 4. ****p < 0.0001, *p < 0.05. d Representative 2-photon time course imaging of EdU+ cells (in green) at different time points post-injury. SHG signal is overlaid with Draq5 nuclear staining. Yellow arrowheads denote severed tendon ends. Scale bar, 100 µm. All error bars in graphs denote the standard deviation.
|